SUIUSDTHello there,
*Mars Signals Team wishes you high profits*
This is a 4-hour-time frame analysis for SUIUSDT
On the top, there is R1 is the resistance area which mentions that the price was not able to rise at different points. And ultimately, S1 is our support area of this chart that obviously contains the support of price variously. As we see in the past, the price trend faced a noticeable rise up to higher amounts and by several rejections and disabilities in order to rise, it could not be supported anymore and continued its falling trend down to areas such as S1. There we had he fluctuation of price in a neutral channel between R1 and S1 and by the last touch at the resistance area, a negative Marubozu Candle was formed and made the price to be unsuccessful at rising again. Hence we have the price fluctuating in a neutral channel between R1 and S1 areas and we should wait for the price to leave this channel and then have a precise prediction via considering the signs and market situation. So we predict the price to receive some support at S1 and by providing us some rising signs, more increase would take place then. Or even by rising over R1 and giving us more fixation there, more rise would definitely happen at that time. Also when the price loses the support and falls below S1, more decline might happen to lower mounts. Please do not forget to wait for some signs such as confirmation candles in order to make sure of what will be your next movement and then act wisely. Our suggestion is to put your stop-loss point based on your amount of loss that you can risk at and try to experience more logical trades.
Warning: This is just a suggestion and we do not guarantee profits. We advise you to analyze the chart before opening any positions.
Wish you success
SUIUSDT trade ideas

SUIUSDT 1H CHARTDisclaimer: This chart and analysis are not meant to be, and do not constitute financial, investment, trading, or other types of advice or recommendations. #DYOR
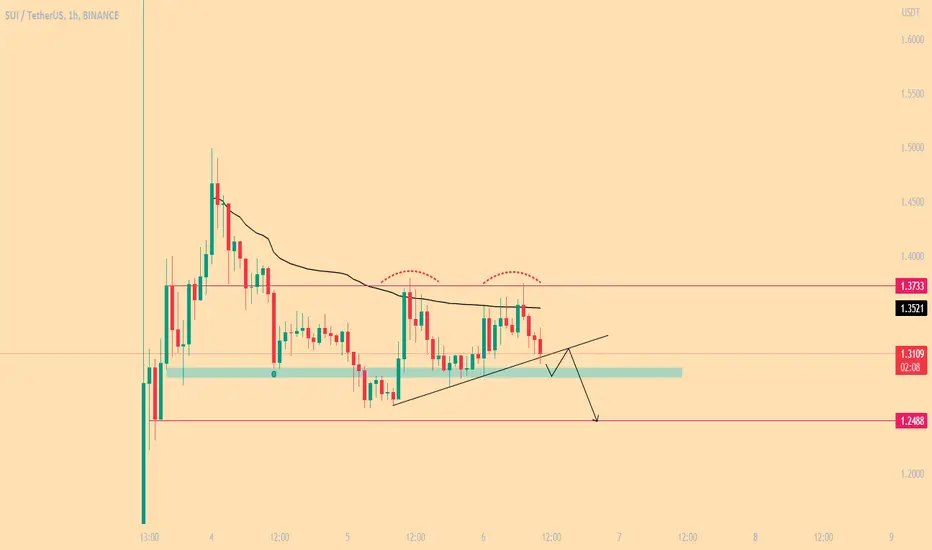
SasanSeifi 💁♂️SUI/USDT 15 MIN ⏭ 1.35 /1.36 HI TRADERS ✌The possible scenario of SUI/USDT is specified. As you can see, the price is currently trading in the 1.30 range.A scenario we can consider is that after a minor correction the price will grow again to the supply area.
Keep in mind that maintaining the support range of 1.26 / 1.23 is important for a positive trend
❎ (DYOR)...⚠⚜
WHAT DO YOU THINK ABOUT THIS ANALYSIS? I will be glad to know your idea 🙂✌
IF you like my analysis please LIKE and comment 🙏✌

SUI VS ARB
Hello everyone! Today I did a review of two new and hype coins - SUI and ARB. Both coins were released at almost the same price, and you can see on the chart the coincidence of entering the market, corrections, accumulation and transition. Personally, I see the growth of the SUI coin, especially the sharp growth and transition. Many people already have this coin, so if you are considering it for investment and long-term goals, then it is a very good coin. In the near future, I expect growth for this coin.
Wishing you a successful day and profits!

SUI formed falling wedge pattern on LTF#SUI formed falling wedge pattern on LTF
Use Proper Risk Management

Long $SUI when there is more Blood.I wanted to share with you my current thoughts on the $SUI. I am watching for more "blood" or red candles on my personal indicator before I go long. This means that I am waiting for the price to drop further before making a move to buy. I am also keeping an eye out for more green candles on my indicator, as this could signal a good entry point for a long position.
For those who do not want to time the market, I recommend considering a dollar-cost averaging (DCA) strategy for $SUI. This involves investing a fixed amount of money at regular intervals, which can help to smooth out the impact of short-term market fluctuations.
Please keep in mind that investing always involves risks, and it's important to do your own research and seek advice from a professional financial advisor before making any investment decisions.

$SUI long ideaNYSE:SUI got launched a couple of days. Usually, coins get dumped on launch. After a couple of days, price retraces and goes back to high. With this, the rr is pretty nice, lets see

SUICurrent Trend foccus pullback off this double top. Watching this range in this channel if we fail this blue line watching the 1.29-1.34 support dorp for any continuation bounce. if we go lower watching foll pullback o a potential additional correction. This Yellow line and BLue line is an important range now and till we break above it
