EUR USD - PRICE HAS TO TAKE A SUPPORT AT 0.5 FIB LEVELEUR USD small sell entry to the 0.5 level fib marked price on chart, price will be take support, follow for more live updates...
Forex market

You should still prioritize buying EURUSDHello dear friends! That's the end of another trading week! Let's recap the markets from last week and discuss our new plan for next week, shall we?
On the previous 1D timeframe we saw the trend change and the market quickly tested the 1.0900 high. But! Unfortunately in the uptrend it is in a consolidation correction above the downtrend resistance level. Confirmation of the trend change would be consolidation above the 1.0750 price level. By observing the chart, we can clearly see EUR/USD reached the 0.618 Fibonacci retracement level and found support there, with the 34 and 89 EMA converging at this support level. Therefore, in the near future, I still prioritize buying according to the trend. It is expected that this increase will reach 1.1079

EURUSD continues its uptrendDear traders! We saw confirmation with the bullish sinking candle, getting support at 1.0830 with confluence from the 34.89 EMA. Therefore, the EU outlook remains very bullish and it is likely that based on our analysis, it continues its upward momentum towards the 1.0880 resistance and shakes open a bullish buy scenario towards the resistance level of the range is 1.0940.

Lingrid | AUDUSD target for SHORT PositionThe price perfectly fulfilled my previous idea. It went up and hit the target. FX:AUDUSD has recently formed an equal low, followed by a bounce off the support level, which is now being tested against the resistance and upward trendline area. On the daily timeframe, we can observe that the market briefly dropped below the significant level of 0.66500, which has acted as both a strong support and resistance zone in the past. This suggests that the bears are currently in control, as they have managed to push the price below this level. On the 4H chart, the market appears to be ranging, with the price pulling back after an initial impulse leg. With bearish momentum building, I expect a test of the support level in the near future. My target is 0.66075 support level.
Traders, if you liked this idea or if you have your own opinion about it, write in the comments. I will be glad 👩💻

HelenP. I Euro can correct to support level and continue to riseHi folks today I'm prepared for you Euro analytics. If we look at the chart we can see how the price some time traded near support 2, which coincided with the support zone and then rebounded down to the trend line. After this movement, the Euro turned around and in a short time rose from the trend line to support 2, broke this level and made retest. Then the price made movement up, after which made a correction to support 2 and then continued to grow. Euro reached support 1, which coincided with the resistance zone, broke this level and some time traded higher even the resistance zone. Later EUR fell to the trend line, which rebounded and backed up at once, but soon it turned around and made an impulse down, thereby breaking support 1 with the trend line too. After this move, the price turned around and in a short time rose to the resistance zone, breaking support 1 one more time, and just now it continues to trades in the resistance area. For this case, I expect that EURUSD will make the little move down to the support level and then rebound up to the trend line. Then, the price can break this line and continue to grow, therefore I set my goal at 1.0915 points. If you like my analytics you may support me with your like/comment ❤️

EURUSD continues to target 1.1000Dear traders! On the demand timeframe we see EURUSD trading on an uptrend basis after it previously broke out of downtrend resistance. The technical outlook is optimistic and the Uptrend will certainly be supported by buyers higher and we would expect a local price increase targeting the medium to long term near the 1.1000 mark.

GBPJPY 197.00 incomingI think gbpjpy is about to pivot and we will soon see 197.000 on the M30 timeframe presents a potential shorting opportunity due to a recent breakout from a wedge pattern.

EURUSD downtrend continuesDear traders! EURUSD continues to remain within a medium to long-term downtrend channel despite some mild recovery yesterday, but overall still unable to overcome 1.0850 resistance amid shifting sentiment from That pulled the EU down sharply to near the 1.0800 support level as of now. Accordingly, Resistance at 1.0850 continues to hold prices amid correction and sell-off. I expect that after a recovery and testing the liquidity of the market, the price will decrease. This decrease is expected to reach 1.0790 and 1.0755 at least.

USDCHF WILL EXPLODE BUYManage SL during news time, intraday trade tp and sl mentioned not a financial advice

GBP_CAD LONG FROM SUPPORT|LONG!
✅GBP_CAD is going down to retest a horizontal support of 1.733
Which makes me locally bullish biased
And I think that we will see a rebound
And a move up from the level
Towards the target above at 1.745
LONG🚀
✅Like and subscribe to never miss a new idea!✅

NZDJPY POSSIBLE SHORT TRADEThe pair has been trading in a bullish trend for some time. It recently got rejected from a strong resistance zone and now looking to retest the same zone.
If the price will be clearly rejected from that zone, I'll be looking for short trades.
Please do your own analysis before placing any trades.
Cheers and happy trading.

EURUSD Bullish Boomerang Trend Continuation EntryEURUSD Bullish Boomerang Trend Continuation Entry looking for trend to continue

AUDUSD There's still space for growthGo higher. The rationale behind :
1. Sentiment on open positions of retail traders
2. Data from the latest COT report on positions of major players
3. Cumulative metrics of technical indicators

USDCHF - Divergence - Heikin Ashi - Long1. Market Analysis:
Asset: USDCHF
Timeframe: 1-hour
Pattern: Bullish divergence identified
Candle Type: Heikin Ashi
2. Entry Criteria:
Divergence Confirmation: Identify bullish divergence on the 1-hour timeframe using indicators like RSI or MACD. Bullish divergence occurs when the price forms lower lows, but the indicator forms higher lows.
Heikin Ashi Confirmation: Look for the formation of the first green Heikin Ashi candle after the bullish divergence is identified, indicating a potential reversal and trend change to the upside.
3. Trade Setup:
Entry Point: Place a buy order at the close of the first green Heikin Ashi candle that confirms the bullish reversal.
Stop-Loss: Set the stop-loss order below the low of the most recent swing low or below the low of the green Heikin Ashi candle that confirms the reversal. This helps limit potential losses if the price reverses.
Take-Profit: Determine your take-profit target based on a risk-reward ratio of either 1:1 or 1:2.

EUR/USD possible short scenario(5/31/2024)We've detected an impulse pattern for EUR/USD.
for confirmation, we need to see the price breaks below the correction line(red line).
Our technical view has been shown in the chart.
If you like it then Support us by Like, Following, and Sharing.
Thanks For Reading
Team Fortuna
-RC
(Disclaimer: Published ideas and other Contents on this page are for educational purposes and do not include a financial recommendation. Trading is Risky, so before any action do your research.)

A B( triangle) then c wave for 2?I like this setup on a low risk sale at 10920-50… see if it plays out.

EURNZD LONGThis is just simple trading idea draw into chart using labels and lines. Please use it as educational purpose and you are free to modify any

EURGBP EURGBP broke LH it can bigger reversal . AS it has divergence and trendline broke Seasonals are also bullish

AUDUSD : CHANNEL PLAY ???The pair has recently been trading inside a bullish channel. It recently tested the support border of this channel which confluence with the key support zone. From this level, the price moved up and now testing another key structural zone. If clear violation of this level, looking for local long positions.
Will this trend continue ??
Please do your own analysis before placing any trades.
Cheers and happy trading.

EURNZD Continuing Bearish TrendEURNZD has a bearish bias and has retraced to the 0.618 to 0.75 zone on 15 minute TF. Anticipating to move towards the previous Lower Low.

NZDJPY Approaching the top of 3.5 years Channel Up. Strong sell.The NZDJPY pair is trading on the 4th straight green 1W candle and is approaching the top (Higher Highs trend-line) of the Channel Up pattern that started on November 2020. Even though it may extend to a +9.30% rise (the smallest long-term it had within the pattern), selling now offers excellent Risk/ Reward conditions. Our target is 92.000 (Higher Lows trend-line).
-------------------------------------------------------------------------------
** Please LIKE 👍, FOLLOW ✅, SHARE 🙌 and COMMENT ✍ if you enjoy this idea! Also share your ideas and charts in the comments section below! This is best way to keep it relevant, support us, keep the content here free and allow the idea to reach as many people as possible. **
-------------------------------------------------------------------------------
💸💸💸💸💸💸
👇 👇 👇 👇 👇 👇

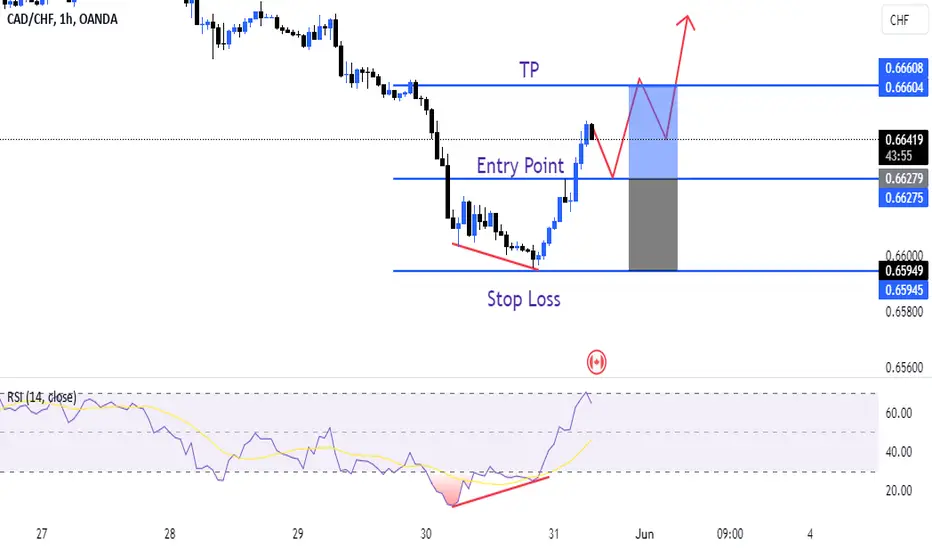
CADCHF IS IN BULLISH TRENDCADCHF is in bullish trend because bullish divergence printing on 1H & 4H time frame buy at retracement of fib level 0.38 or 0.50 complete trade plane is mentioned in chart
GBP AUD - Short IdeaOn 1H forming a bearish divergence and kinda look like a double top. Will trigger my sell stop on break of the neckline. Entry, SL and TP's all mentioned in the chart. Good Luck
