USDJPY OUTLOOK Current technical outlook on USDJPY.
In alignment with the bearish dollar (earlier post) and expected rate cut towards the end of the year.
I expect some sell to the down side on the USDJPY pair.
"May fortune attend thee, and thy trade prosper." .......L2Earned
USDJPY trade ideas

Short-term USDJPY buying strategyHello dear traders! Overall, the pair remains supported amid rising US Treasury yields and the US dollar after Fed officials adopted a cautious stance on the policy and inflation outlook. The CME FedWacth tool shows a 68% probability of interest rates falling from current levels in September, down from the 73% seen after the release of mild inflation data.
On the chart, an ascending channel has started to appear, which usually determines our medium-term outlook. By maintaining this aggressive buying level, there is a possibility that the current Resistance level of 156.55 could serve as a slight cooling target targeting the 155.50 support level for accumulation before a breakout and realization is now further enhanced. It is expected that this price increase will reach the 158.30 mark.

USDJPY Uptrendline Breakout ? 28.05.2024
- Uptrendline breakout to the downside observed on 1hr USDJPY chart
- If breakout holds, potential for rate decrease
- If breakout fails, potential for rate increase
- Risk management recommended
Risk Warning: Trading in CFDs is highly speculative and carries a high level of risk. It is possible to lose all of your invested capital. These products may not be suitable for everyone, and you should ensure that you fully understand the risks taking into consideration your investment objectives, level of experience, personal circumstances as well as personal resources. Speculate only with funds that you can afford to lose. Seek independent advice if necessary. Please refer to our Risk Disclosure.
BDSwiss is a trading name of BDS Markets and BDS Ltd.
BDS Markets is a company incorporated under the laws of the Republic of Mauritius and is authorized and regulated by the Financial Services Commission of Mauritius ( FSC ) under license number C116016172, address: 6th Floor, Tower 1, Nexteracom Building 72201 Ebene.
BDS Ltd is authorized and regulated by the Financial Services Authority Seychelles (FSA) under license number SD047, address: Suite 3, Global Village, Jivan’s Complex, Mont Fleuri, Mahe, Seychelles. Payment transactions are managed by BDS Markets (Registration number: 143350)

USDJPY H4 | Bullish bounced?Based on the H4 chart analysis, we can see that the price has just bounced off our buy entry at 156.58, which is an overlap support.
Our take profit will be at 158.00, a swing-high resistance level close to 127.2% Fibo extension
The stop loss will be placed at155.86, which is an overlap support level.
High Risk Investment Warning
Trading Forex/CFDs on margin carries a high level of risk and may not be suitable for all investors. Leverage can work against you.
Stratos Markets Limited (www.fxcm.com):
CFDs are complex instruments and come with a high risk of losing money rapidly due to leverage. 68% of retail investor accounts lose money when trading CFDs with this provider. You should consider whether you understand how CFDs work and whether you can afford to take the high risk of losing your money.
Stratos Europe Ltd, previously FXCM EU Ltd (www.fxcm.com):
CFDs are complex instruments and come with a high risk of losing money rapidly due to leverage. 70% of retail investor accounts lose money when trading CFDs with this provider. You should consider whether you understand how CFDs work and whether you can afford to take the high risk of losing your money.
Stratos Trading Pty. Limited (www.fxcm.com):
Trading FX/CFDs carries significant risks. FXCM AU (AFSL 309763), please read the Financial Services Guide, Product Disclosure Statement, Target Market Determination and Terms of Business at www.fxcm.com
Stratos Global LLC (www.fxcm.com):
Losses can exceed deposits.
Please be advised that the information presented on TradingView is provided to FXCM (‘Company’, ‘we’) by a third-party provider (‘TFA Global Pte Ltd’). Please be reminded that you are solely responsible for the trading decisions on your account. There is a very high degree of risk involved in trading. Any information and/or content is intended entirely for research, educational and informational purposes only and does not constitute investment or consultation advice or investment strategy. The information is not tailored to the investment needs of any specific person and therefore does not involve a consideration of any of the investment objectives, financial situation or needs of any viewer that may receive it. Kindly also note that past performance is not a reliable indicator of future results. Actual results may differ materially from those anticipated in forward-looking or past performance statements. We assume no liability as to the accuracy or completeness of any of the information and/or content provided herein and the Company cannot be held responsible for any omission, mistake nor for any loss or damage including without limitation to any loss of profit which may arise from reliance on any information supplied by TFA Global Pte Ltd.
The speaker(s) is neither an employee, agent nor representative of FXCM and is therefore acting independently. The opinions given are their own, constitute general market commentary, and do not constitute the opinion or advice of FXCM or any form of personal or investment advice. FXCM neither endorses nor guarantees offerings of third party speakers, nor is FXCM responsible for the content, veracity or opinions of third-party speakers, presenters or participants.


USDJPY Massive Long! BUY!
My dear friends,
My technical analysis for USDJPY is below:
The market is trading on 156.67 pivot level.
Bias - Bullish
Technical Indicators: Both Super Trend & Pivot HL indicate a highly probable Bullish continuation.
Target - 156.78
About Used Indicators:
A pivot point is a technical analysis indicator, or calculations, used to determine the overall trend of the market over different time frames.
———————————
WISH YOU ALL LUCK

USDJPY reversal in H1USDJPY just reaching another high. I go for sells in here. 23 pip SL/ 23 pip Exit 1

USDJPY, growth to bulls target zone 157.15 - 157.34Hi friend. JPY continue bears accumulation proces so price will turn upper to 157.14 - 157.34. I mark all interesting market prices for you. Follow me;)

✨FULL USDJPY. Multitimeframe Analysis✨☝️Do not act based on my analysis, do your own research!!
The main purpose of my resources is free, actionable education for anyone who wants to learn trading and improve mental and technical trading skills. Learn from hundreds of videos and the real story of a particular trader, with all the mistakes and pain on the way to consistency. I'm always glad to discuss and answer questions. 🙌
☝️ALL ideas and videos here are for sharing my experience purposes only, not financial advice, NOT A SIGNAL. YOUR TRADES ARE YOUR COMPLETE RESPONSIBILITY. Everything here should be treated as a simulated, educational environment. Important disclaimer - this idea is just a possibility and my extremely subjective opinion. Do not act based on my analysis, do your own research!!

USDJPY continued its upward trajectory on MondayUSDJPY continued its upward trajectory on Monday, consolidating above the 156.00 handle. Should this momentum pick up later in the week, resistance appears at 158.00, followed by 160.00. It's important to exercise caution with any ascent towards these levels, considering the possibility of FX intervention by Japanese authorities to bolster the yen. Such a move could quickly send the pair into a tailspin.
Alternatively, if selling pressure resurfaces and prompts the pair to reverse course, initial support is positioned at 154.65. While prices are expected to stabilize around this zone during a pullback, a breakdown could precipitate a swift decline toward 153.15. If weakness persists, attention could turn to trendline support and the 50-day simple moving average near 152.50.

UJ potential sell off JPY News?Red folder JPY news tonight 8pm EST / 7pm CST
per forexfactory.com
Looking at liquidity below to be the target
nice potential range play
Paytience pays


USDJPY Possible Short positionHi Traders,
USDJPY broke the uptrend line and has formed a bearish divergence, if price breaks or close below support line at 156.885, you can take a short position at around 156.860 take profit at 156.510 and stop loss at around 157.190
Thanks,
Happy trading

USDJPY: Short Trade Explained
USDJPY
- Classic bearish setup
- Our team expects bearish continuation
SUGGESTED TRADE:
Swing Trade
Short USDJPY
Entry Point - 157.06
Stop Loss - 157.91
Take Profit - 155.55
Our Risk - 1%
Start protection of your profits from lower levels
❤️ Please, support our work with like & comment! ❤️

USDJPYLooking for a sell opportunity in UJ.
waiting for the price push to the level of Resistance to make double top.
Use proper risk management.
Thank you

USDJPY H4 | Bearish Drop Based on the H4 chart analysis, we can see that the price has just reacted off our sell entry at 156.93, which is a swing high resistance.
Our take profit will be at 154.60, a pullback support level close to 78.6% Fibo retracememt
The stop loss will be placed at 158.00, which is a swing-high resistance level.
High Risk Investment Warning
Trading Forex/CFDs on margin carries a high level of risk and may not be suitable for all investors. Leverage can work against you.
Stratos Markets Limited (www.fxcm.com):
CFDs are complex instruments and come with a high risk of losing money rapidly due to leverage. 68% of retail investor accounts lose money when trading CFDs with this provider. You should consider whether you understand how CFDs work and whether you can afford to take the high risk of losing your money.
Stratos Europe Ltd, previously FXCM EU Ltd (www.fxcm.com):
CFDs are complex instruments and come with a high risk of losing money rapidly due to leverage. 70% of retail investor accounts lose money when trading CFDs with this provider. You should consider whether you understand how CFDs work and whether you can afford to take the high risk of losing your money.
Stratos Trading Pty. Limited (www.fxcm.com):
Trading FX/CFDs carries significant risks. FXCM AU (AFSL 309763), please read the Financial Services Guide, Product Disclosure Statement, Target Market Determination and Terms of Business at www.fxcm.com
Stratos Global LLC (www.fxcm.com):
Losses can exceed deposits.
Please be advised that the information presented on TradingView is provided to FXCM (‘Company’, ‘we’) by a third-party provider (‘TFA Global Pte Ltd’). Please be reminded that you are solely responsible for the trading decisions on your account. There is a very high degree of risk involved in trading. Any information and/or content is intended entirely for research, educational and informational purposes only and does not constitute investment or consultation advice or investment strategy. The information is not tailored to the investment needs of any specific person and therefore does not involve a consideration of any of the investment objectives, financial situation or needs of any viewer that may receive it. Kindly also note that past performance is not a reliable indicator of future results. Actual results may differ materially from those anticipated in forward-looking or past performance statements. We assume no liability as to the accuracy or completeness of any of the information and/or content provided herein and the Company cannot be held responsible for any omission, mistake nor for any loss or damage including without limitation to any loss of profit which may arise from reliance on any information supplied by TFA Global Pte Ltd.
The speaker(s) is neither an employee, agent nor representative of FXCM and is therefore acting independently. The opinions given are their own, constitute general market commentary, and do not constitute the opinion or advice of FXCM or any form of personal or investment advice. FXCM neither endorses nor guarantees offerings of third party speakers, nor is FXCM responsible for the content, veracity or opinions of third-party speakers, presenters or participants.

USDJPY STRUCTURE I know what you are thinking, Dr. Trade are you not seeing a valid supply zone, are you not seeing a valid Order block, are you not seeing a huge level of imbalance, well let me remove you from pattern trading and make you see the bigger picture, this is what we will follow for this pair
#BUYS ONLY

USDJPY, growth must be. Long (in time) accumulation.Hi friend. I write this idea becouse we have difficult to analyse accumulation process on USDJPY market. For the first market formed medium bears accumulation zone "1" between 156.88 - 157.14 then bulls entering at zone "2" - 156.7 - 156.94. I put my SL at 156.6 and waiting growth to strong resist level 157.46. Suppport me;)

USD/JPY: Ride this Third wave Decline.The decline from 160.24 high subdivides into five waves. This move is significant as it identifies the dominant trend as down. The technical name for this pattern is a leading diagonal.
The subsequent three-wave price action unfolding in USD/JPY supports this bearish conviction. Countertrend price action commonly subdivides into a three. It is often slow, choppy and typically contained within a parallel channel. The technical name for this rally is a Zigzag pullback.
As illustrated earlier in my education ideas, in zigzag formations, the upper boundary of a parallel channel often projects the end of wave C with dramatic precision.
Moreover at 158.52, wave C would equal the length of wave A which is a common Fibonacci relationship in zigzag formations.
It is also the case that when a leading diagonal occurs in wave (1) position of an impulse, it is sharply retraced by a zigzag correction with 61.8% and 78.6% levels common targets. Although not shown,the 78.6% retracement level corresponds to the upper boundary of the trend channel and wave C equality target.
So in anticipation of wave (3) decline; a trader's bread and butter, the recommendation is to short at or near the 61.8% retracement level. The Protective Stop will be placed at 160.24; the origin of this decline. Why? Wave (2) of an impulse can NOT retrace more than 100% of wave (1).
The target for this trade is a drop of at least 13.58 as in (160.24 - 151.83) X 1.618. Why? As a guideline, wave (3) of an impulse often extends and commonly travels 1.618 times the length of the (1). A Risk: Reward of 1:3
Working with 153.60 as our key level. A break below this level would hint that wave (2) is over and wave (3) to the downside is underway.
Have a profitable trading week!

bullish asian move opportunitybullish candles momentum is to the upside, targeting 157.600 and 158, liquidity got taken out

Usdjpy sells.On the monthly timeframe it has reached the resistance. I speculate a huge retracement from here and i will be looking for a sell entry on the lower time frame

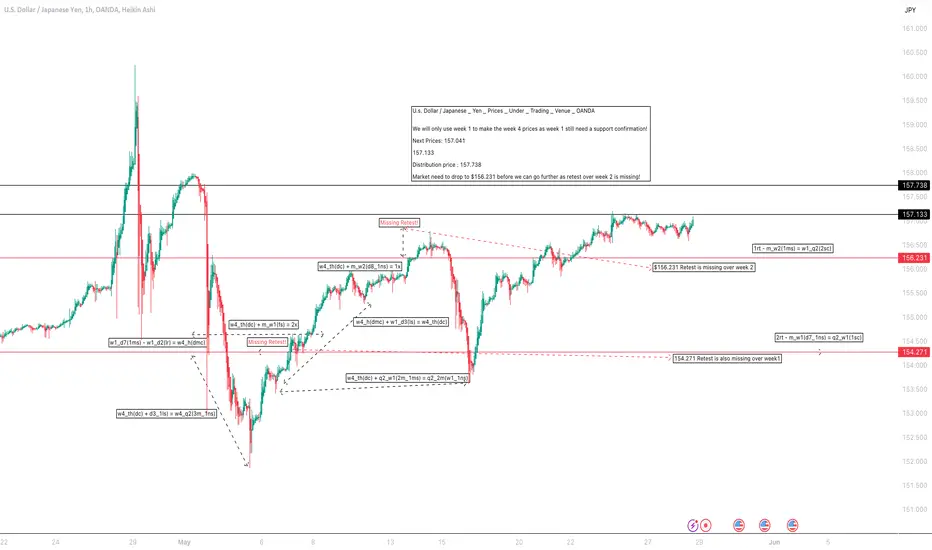
U.s. Dollar / Japanese _ Yen _ Prices _ Under _ Trading _ Venue U.s. Dollar / Japanese _ Yen _ Prices _ Under _ Trading _ Venue _ OANDA
We will only use week 1 to make the week 4 prices as week 1 still need a support confirmation!
Next Prices:
157.041
157.133
Distribution price : 157.738
Market need to drop to $156.231 & 154.271, before we can go further as retest over week 2 is missing!
USDJPYUSDJPY is in strong bullish trend.
As the market is consistently printing new HHs and HLs.
currently the market is retracing a bit after last HH, which is 38% Fib retracement level and local support as well. if the market successfully sustain this buying confluence the next leg up could go for new HH.
What you guys think of this idea?
