LTTS BRAKEOUT ON 1 HOUR CHARTNSE:LTTS
Ltts is a very reputed company . its gives brake out on 1h chart.
Buy rate 4650
sl 4550
target 4900
LTTS trade ideas

LTTS weekly chart round bottomLTTS weekly Chart
Round bottom pattern
2 years high breaking IT stocks
support 4810
resistance 5833
USA inflation has ease
expected level ?

LTTS: Beautiful Breakout But ...The chart should give you everything you need to know. But here are some pointers for those who like to read:
- A beautiful Symmetric Triangle breakout. The support and resistance trendlines were religiously followed. Thus, making the pattern stronger.
- The consolidation period was a good 15 months. Every IT company has gone through the pain.
- We have defined support and resistance zones. The triangle breakout is good but is exactly near the Crucial resistance zone.
- A break and sustenance of it will be crucial for the future upmove.
- We have a 5000 psychological level sitting on the top as our first target
- Nifty IT is also gearing up for some long-due momentum. This should give a push.
What should we analyze next??
Have Requests, Questions, or Suggestions? Let us know in the comments below.👇
While you do that, how about a boost for some motivation🚀
⚠️Disclaimer: We are not registered advisors. The views expressed here are merely personal opinions. Irrespective of the language used, Nothing mentioned here should be considered as advice or recommendation. Please consult with your financial advisors before making any investment decisions. Like everybody else, we too can be wrong at times ✌🏻


ASCENDING TRIANGLELLTS 15M
Analysis:
The trend is in upward and the price is not making higher high forming a resistance while the price is making higher lows and taking support on trendline.

LTTS is facing ResistanceLTTS can be a good buy or sell for tomorrow as it is an all-time high.
If it breaks the level of 5560 then take buy-side trade but be careful as the market is bearish and you are on an all-time high.
And if it gives any rejection candle in 5 min. timeframe and confirm its reversal move by another bearish candle then take the sell side trade and targets can be 5546,5526. Further, it can also fill the gap and the target would be 5388 i.e. 200 EMA.

LTTS Yesterday on resistance a big marubozu candle generate a signal & today confirm candle stick pattern. Market sentiments very Bearish.
Macd also indicate some downside move possible
RSI indicate bearish
Make a fresh short when today low break.
Disclaimer This is my personal view for education purpose only
No Buy sell recommendations

LTTS - Intraday Pick for 07-12-2023INTRADAY TRADE
LTTS Looks Good ABOVE 4873
SL 4754
Targets 4932.25-4991-5074 points from entry
Hold few Months
Please consult your financial advisor before investing
All research for educational purposes only.

#LTTS looks amazing for a long#LTTS
L&T Technology Services as well looks amazing. Moving fast towards ATH and then sky is the limit.
Breaking a crucial level today.

L&T Technology Services LtdTARGET AND STOP LOSS GIVEN IN THE CHART
Market Cap
₹ 44,017 Cr.
Current Price
₹ 4,168
Stock P/E
35.6
Book Value
₹ 469
Dividend Yield
1.08 %
ROCE
32.8 %
ROE
25.0 %
Face Value
₹ 2.00
Promoter holding
73.8 %
EPS last year
₹ 111
EPS latest quarter
₹ 29.4
Debt
₹ 454 Cr.
Pledged percentage
0.00 %
Net CF
₹ 290 Cr.
Price to Cash Flow
33.8
Free Cash Flow
₹ 1,132 Cr.
Debt to equity
0.09
OPM last year
21.4 %
OPM 5Year
20.0 %
Reserves
₹ 4,930 Cr.
Price to book value
8.89
Int Coverage
39.0
PEG Ratio
2.02
Volume
6,53,708
Price to Sales
5.05

LTTS Try for Breakout but not success today Wait for tomorrow
Chart setup is good for long volume also show strength
NIFTY IT show strength
So more chances to upside possible in IT Stocks.
Macd Bullish
RSI Bullish
Moving averages also indicate Bullish on chart.
Disclaimer:- This is my personal view for education purpose only.
No Buy sell recommendations.

Bullish on Indian Tech StocksThe top 4 Tech Charts look strong and bullish, InfoSys being the weakest of the bunch and chugging along.
As long as the prices stay above the Green Trap Zone we are Bullish on these 4 symbols.
Boost Ideas If you like and lets Go !

LTTS - STRONG BREAKOUTLTTS - Continuing with previous post for LTTS...I think Impulse move has started...Look at bigger picture...

LTTS - HEADING TOWARDS 4500 ZONESLTTS is clearly in channel and it is heading towards 4500...Buy on all the dips...


lttsbagged a $50 million five-year contract from a global technology company for product enhancement.

LTTS on retest post brange breakoutLTTS currently under retest and above strong demand zone after good breakout. expecting small upward movement

Ascending Triangle Forming in LTTSLTTS is consolidating in an ascending triangle pattern.
The pattern is usually a bullish continuation pattern. Chances are price might breakout on upside from the triangle.
Add this stock in your watchlist and wait for the breakout.
LTTS - Bullish ConsolidationNSE: LTTS is closing with a bullish consolidation candle supported with volumes.
Today's volumes and candlestick formation indicates strong demand and stock should move to previous swing highs in the coming days.
The stock has been moving along the horizontal support for the past few days which is indicating demand.
One can look for a 8% to 12% gain on deployed capital in this swing trade.
The view is to be discarded in the event of the stock breaking previous swing low.
#NSEindia #Trading #StockMarketindia #Tradingview #SwingTrade

LTTS - Weekly AnalysisIn the Weekly Chart of LTTS ,
we can see that; it has retested the W pattern breakout.
Expecting higher targets from here.

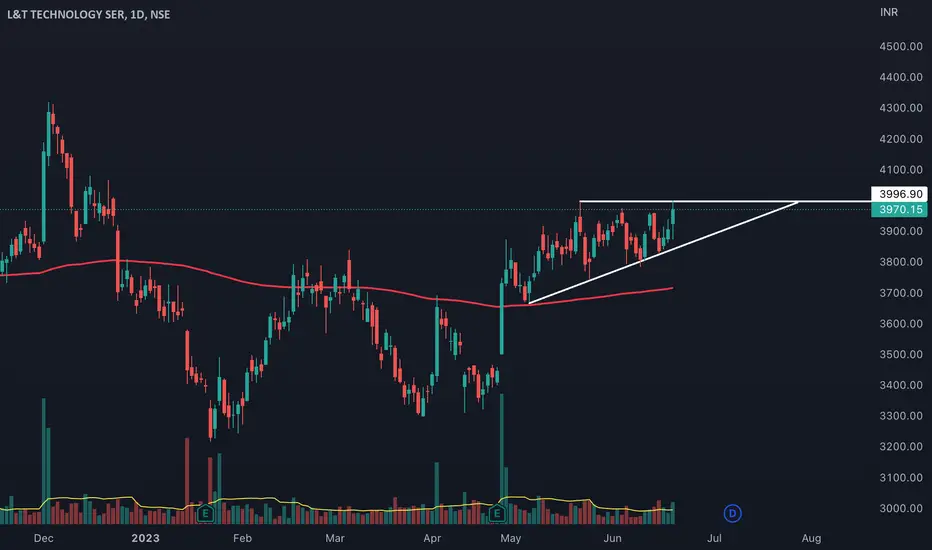
LTTS Triangle pattern and double bottomTriangle pattern and double bottom pattern there .
Double bottom neck line place now market.
We can expect bullish.
