Sail is Sailing!A crucial level is broken at 174.90. Price is clearly indicating another up move on the chart, this is a retrace to another level. Start accumulating from 155 to 145 Levels. Targets on the higher sides are 234.5 and 290.

NVDA: Is the incredible run coming to an end?NVDA chart is as bullish as it can get. Monthly close is as strong as it can get. There is nothing bearish about this at this moment. And this is where I get my spidey senses tingling. I am looking at a couple little things to be cautious.
1. Price hit the 2.618 fib extn from cycle wave 1 and 2. This is as good place as any to complete primary wave 3. Regardless of what the future holds, this extension is a great resistance. The reaction from this spot has been pretty sharp, but there is no sign of deeper damage yet.
2. RSI negative divergence: On the monthly timeframe the divergence is very clear. On daily timeframe, things are very frothy. There is no indication of a macro turn yet, but this is where things get unpredictable.
We need to see where the weekly closes. At this point no bearish setup until we see a weekly close below 900. After stock split things might start to get interesting.

NVDA to 1300 in next breakout. I believe NVDA will be $2,000 in a flash. but that's larger time frame. For now let's focus on seeing it hit $1,300 first.
Not financial Advice. But Most people didn't notice my MSTR ideas when I was banging the table. It was $487 and I believed it would hit $800 first. then after i saw the strength to $1,300 and quick support it created above $1,000, I KNEW $2,000 was coming.
Same vibes here. NFA - thoughts only

AMR Fib. Expansion. Next Resistance Level 457.80$After pullback, security has lost its value approximately %20 but that was pullback. It has happened with gap in daily chart. 07 August 2023 Symmetrical Triangle resistance was broken and second pullback can occur 457.80$ level. At the end of this week, we have to close this security more than 340.65$ level and it will be our support line.

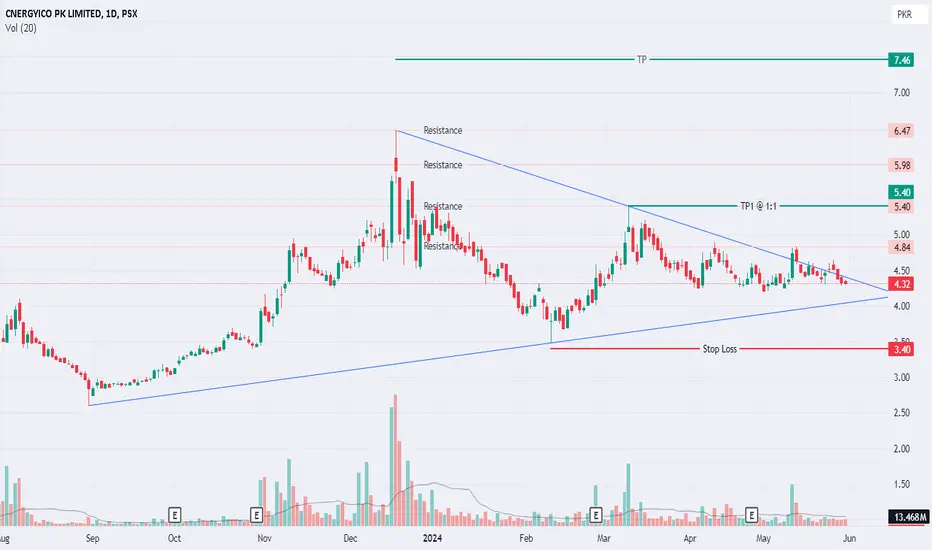
PSX: CNERGY foundation has been laid.From the start of this year the CNERGY has been struggling to sustain it journey to north and has not been successful in its attempts. In all this a triangle has been formed suggesting that it will resume its journey in whichever direction it breaks. Currently the price is breaching the upper trend line creating a bias for upward movement.
SL for the trade is 3.40 & correspondingly the TP is 5.40. Close above 5.40 shall lead to the medium term TP which is 7.48
Wishing you Profitable Trading
Gap Stock Surges 26.87% After Revenue BeatGap shares ( NYSE:GPS ) surged more than 27% in Friday's trading session after the clothing and accessories retailer posted a better-than-expected quarterly earnings report and raised its full-year guidance. Comparable store sales in the quarter rose 3% from a year earlier, driven by each of Gap's four brands posting positive same store sales in the period. New CEO Richard Dickson has led an ambitious turnaround plan that has seen the retailer work on improving its operational efficiency and repositioning the company’s brands.
Gap's ( NYSE:GPS ) comparable store sales increased 3% from the year-ago period, showing a significant improvement from a 4% decline in last year’s corresponding quarter. The turnaround was driven by positive same store sales growth in each of the retailer's four brands, which include Old Navy, Gap, Banana Republic, and Athleta. Looking ahead, the company raised its full-year guidance, saying it now expects net sales to be up slightly, an improvement on its prior forecast where it projected flat annual sales. It also lifted its full-year operating income outlook to the mid-40% growth range, significantly higher than its earlier forecast of growth in the low-to-mid teens.
Gap ( NYSE:GPS ) CEO Richard Dickson told CNBC in an interview following the quarterly results that the plan is working and resonating with investors. Since finding a bottom in May last year, Gap shares have trended higher, with gains accelerating after the 50-day moving average (MA) crossed above the 200-day MA in early October to form a golden cross pattern. Leading into the retailer’s quarterly results, the stock has rallied towards the 50-day MA after a period of recent consolidation, indicating bullish expectations by market participants.
Amid the stock’s projected earnings-driven surge on Friday, investors should closely monitor the $28.50 level, an area where the price would likely run into overhead resistance from its March 2024 high. Gap's ( NYSE:GPS ) upgraded outlook gives Wall Street fresh proof that CEO Richard Dickson's turnaround strategy - to introduce trendier styles across its brands and ramp up marketing efforts to attract picky shoppers - is paying off less than a year after he joined the struggling mall retailer from Mattel.
The stock experience massive surged in price after a "Golden Cross" pattern exhibited since the last week of September, 2023 surging through to New Highs

Suzlon - 2 cup with handle pattern formationThere is a cup with handle pattern as shown in the chart. The technical target of first pattern is 53.55 and the technical target of second pattern is 62.10. The technical targets are supported by good financial results of the company in the past few quarters. Previous quarter also the company performed well and showed its highest ever net profit in the past few quarters. So this can be considered a good trade.
Hope you like my analysis.
Please do your own analysis before investing.
Do like and follow and share among your friends and family.
Thank you.

Breakout " Renuka Sugars " Small Moment variable to BIG MoveBreakout " Renuka Sugars " Small Moment variable to BIG Move, Please observe for 2days then move accordingly
Note : I am Not a SEBI Registered Analyst. All Post and Levels Posting is only for educational and knowledge purpose. I Am not responsible for your any kind of loss or profit.
No Claim, All Rights Reserved.‼️

Sun Pharma is now under Breakout for Long RunSun Pharma is now under Breakout for Long Run
Note : I am Not a SEBI Registered Analyst. All Post and Levels Posting is only for educational and knowledge purpose. I Am not responsible for your any kind of loss or profit.
No Claim, All Rights Reserved.‼️

Nvidia Takeoff!! $1039 with earnings around the cornerNvidia earnings around the corner are we going to make another ATH in Spy! Will Nvidia get us there, I think so GPU 50 series release Rumors more Cloud Technology added in GPU's!! What else could you ask for in an AI boom!! $1039 price target for Nvidia

Nvidia Major Top at 1,158.19Nvidia Corporation (NVDA) Elliott wave count from its major bottom made in October 2008 appears complete.
On 05/30/24 NVDA high was 1,158.19. Major Fibonacci resistance is at 1,157.70 almost a bullseye hit.
Daily MACD – Histogram has flattened out.
Stochastic has bearish lines cross.
None of the other “Magnificent Seven” stocks confirmed NVDA new high.
None of the three main U.S. stock indices made new all-time highs.
If NVDA has made a major top it could signal the beginning of a multi-month decline in U.S. stocks.

SWING IDEA - DEEPAKFERTPrice Action is making Lower Low Pattern, while MACD Cross is making Higher Low Pattern.
MACD is showing good momentum upward.
The stock should be ready for its next leg up, at least until the next Support/Resistance zone.
Worst case, a retest to the nearest Support zone @ 480 levels.
Any weekly closing under this level can take the stock to new lows.
Trade with the Trend.

PLTR: Buy ideaBuy idea on PLTR as you see on the chart because we have the breakout of the vwap and the resistance line so it's mean that we will have a hight probability to have an uptrend.Thanks!

Trend continuation in $AMDAfter correcting the previous big rise, the stock has formed an inverted Shoulder-Head-Shoulder pattern that has broken out to the upside. Both in the daily and weekly timeframe it is above the SMA 30 and a crossover of averages can be observed in an oversold Stoch RSI in the weekly timeframe.
In favor and accompanying the trend we have the reference index NASDAQ:SOX at maximums, although we must keep an eye on the divergence that has formed in the weekly RSI.

WULF - Rekt Sheep 💀Ascending wedge appears to be drawing to a close here.
It has become very shallow and calm in this recent area.
Calm tends to arrive before a storm.
There are bearish RSI divergences that cannot be seen through rose tinted glasses.
Earnings later today could do anything...
But right here WULF looks set to roll off the table down and down 👇🏻.
Fanboys that can't read a chart are about to find out 💀.
Not shorting, I only want deep buys down the road...
Not advice

AI: the trend now be beginningAI: the trend now be beginning
-Shakeout and backtest successfully.
-Volume exhausted at the bottom.
-Strong demand has confirmed.
.
Let's go!
More free plans at fb group: US STOCKS- WALL STREET DREAM
.
US STOCKS- WALL STREET DREAM- LET'S THE MARKET SPEAK!

AMC pumps price and volume into fair value zone LONGAMC is on a 4H chart with a set of VWAP bands overlaid In the past two trading sessions price
and volume have pumps and so also the PV Trend indicator. There is no fundamental
footprint on this move. it is a pure meme much like a similar move of GME. I will go long
here hoping to ride the momentum and capture profit. I will set a stop loss fo 10% n
recognition of the volatilit The final target is the $ 120 range pivots of April and
August 202. The initial target is the $35 range of the ranging zone of August 2023. Upon
reaching the first target I will cut the position to 50% for the leg higher. I will cut the position
if momentum fades especially if the volume fades with it. This will be interesting at the least
and highly profitable at the very most.

NBCC Long Term Outlook.Picture Perfect Weekly and Monthly Closing. India on the cusps of Making History again as stable govt. is about to get re-elected for a third consecutive term. I am expecting a 4-5 times kind of return from the current date i.e. 01.06.2024. Time frame should be 3 Years. See you all in 2028.

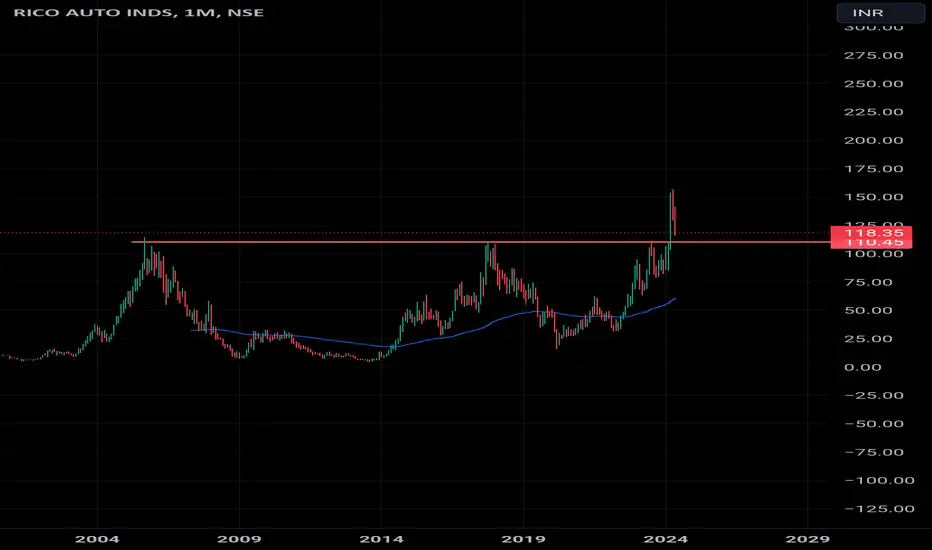
20 years breakout Rico IndiaThis stock has given breakout after 20 years
recently it broke resistance of 110 and moved up with strong volumes
But to enter lets wait for retest and make entry@110 SL should not be more than 5-7 %
$CRMNot financial advice.
NYSE:CRM
weekly candle chart entering a common A, B, C correction.
Gaps to be filled in purple boxes.
will see what time says.
Like and follow for more ideas.

Glemark idea | Key levelsGlemark idea | Key levels ( Probabilities )
Glenmark to remain bullish above the trendline
Targets - 1233/1256/1303/1335/1414/1525
stop loss - 1116

Adobe : TIME to accumulateHello there,
New Idea, US STOCK.
H&S inverted. Buy between 420-445.
MA RED weekly bounce probably.
If the partern is confirmed : Target 1000 dollars
SAFE ENTER : Break the channel

$MSTR tricky path to $3000+?This looks like the most interesting long setup in crypto mining should the opportunity present itself.
In the short term, I think price will likely continue up into the $1400-1500 range. If price can't break through that level, I think it'll be a great short.
If you look at the correction so far, we've only had 2 legs down, I think the 3rd is yet to come which will bring us into the sub $1000 support zone.
If we get down there, I think that'll create a great buying opportunity and price should surge higher into the $3000+ resistance level.
So if you buy the bottom and sell towards the top, there's 3x gains to be had.
I'll likely play this in both spot and options as there will be great money to be made if you can time this well.
Good luck.
