Dow: Key data, earnings and US election all coming upStocks rebounded on Monday with oil prices taking a 5% plunge, amid an apparent easing in Middle East tension. The restrained reaction by Israel after recent attacks has spurred optimism, with markets hoping for stability in the region. European indices closed higher as we begin a very busy two weeks, with lots of data, US election and central banks meetings on the way.
Treasury yields could take toll on stocks
With the 10-year rising to a new 3-month month high of 4.29%, this could unravel risk assets. Having just closed lower for the fifth consecutive day, resulting in a weekly loss of more than 2.5%, the Dow could be the one to watch for potential underperformance. Small caps also slumped last week, while the tech-heavy Nasdaq finished flattish, helped by Tesla’s earnings and Nvidia surging to a new record high.
Looking under the hood, financials (XLF) led the drop on Friday with a fall of 1.1% and nearly 2.1% for the week. Industrials (XLI) lost 2.8% on the week, while energy (XLE) lost 0.6% on the week and ensured a hattrick of weekly losses. Technology (XLK) was flat on the week, while semiconductor (SMH) rose 0.6%. Once again gold outperformed with GLD rising 0.8% last week.
With financials and industrials taking the biggest hit, and energy also not doing great, the Dow and Russell are the obvious markets for the bears to potentially target, if sentiment turns sour again.
Economic Data Points to Slower Rate Cuts
Last week’s stronger economic indicators have reinforced expectations that the Federal Reserve may take a measured approach to future rate cuts, but will that change in the week ahead with some top-tier data to come including JOLTS, non-farm payrolls and ISM surveys? Last week’s data releases—such as jobless claims, services PMI, and durable goods orders— all surpassed forecasts, suggesting economic resilience. If we see a similar outcome from most of this week’s data releases, then that could even raise question marks over further rate cuts beyond the two more priced in for this year, as the Fed may be more inclined to wait and see before easing policy further.
While a strong economy supports corporate earnings, it can also sustain higher yields, which may weigh on stock valuations. As a result, traders and investors are closely watching incoming data to gauge whether the Fed will indeed adopt a more gradual approach to rate reductions.
US Election Uncertainty Adds Pressure
The US presidential election is also in focus, with polls and odds markets showing a close race. Some betting markets are leaning toward a Trump victory, while other polls show a tie. A Trump win could have inflationary implications, potentially impacting the Federal Reserve’s approach to rate policy. Given Trump’s policies, investors may anticipate a more aggressive Fed response to manage potential inflation, which could affect stock prices and increase market volatility.
The uncertain outcome has led investors to adopt a cautious stance, with many waiting to see how the election results may influence the Fed's future policy decisions and overall market sentiment. This has been evident in markets falling last week, VIX rising and gold hitting new record highs.
Upcoming Earnings and Economic Reports
As we head into a pivotal week and a half, several high-impact events could shape market direction. Investors are bracing for a series of earnings reports from major companies, often referred to as the "Magnificent 7" stocks, alongside the US monthly jobs report. These, combined with the US election on November 5, represent a series of risk events that could sway investor sentiment.
Given the recent increase in yields, strong economic data, and the close election race, it is unlikely we’ll see investors rush to buy the dips. For now, a cautious approach may be warranted as investors navigate these uncertainties and await clearer signals for the market’s direction.
Week ahead: Jolts, BoJ, NFP and lots of earnings
There are at least a couple of major macro factors that could impact the Dow this week, while on a micro level, several tech names are reporting their results.
1) JOLTS Job Openings (Tuesday)
With the Fed’s focus turning to employment, we will give preference to any labour market indicators over other data releases in the next couple of months. Though this data release is not very up to date (with this one covering August), it can still impact the market because job openings are a leading indicator of overall employment, and they usually take a few months to be filled. Last time we saw a surprisingly strong print of 8.04 million, aiding the dollar’s rally.
2) US nonfarm payrolls (Friday)
Last month’s surprisingly good nonfarm payrolls data helped to fuel a big rally in the dollar as the market was forced to drop its calls for further outsized rate cuts from the Fed. Let’s see if those numbers will be revised and whether the strength in the labour market continued for another month. Any further strength in employment data could even call into question the now lower expectations of 50 basis points worth of more rate cuts in the next two FOMC meetings in 2024. This will undoubtedly move the Dow and other US indices too.
Dow key levels to watch
The technical Dow forecast has turned a tad bearish following last week’s drop. The last weekly drop of a similar magnitude took place in early September. That time, though, there was no immediate election risk, and so the index quickly bounced back and went on to hit new records in the pursuing weeks. This time, it could be different. Still, we will need to see a lower low to confirm the bearish reversal beneath the last short-term low at 41,800.
If seen, we could see a sizeable drop with the next obvious support not seen until around 40,900 to 41,000 area. The longer-term trend line and 200-day average converge around the psychologically important area of 40,000.
Standing in the way of these potential support levels is another one close to where the market finished on Friday and where it has staged a bounced from today, around 42,000.
In terms of resistance levels to watch, the most important one in my view lies at 42,400 to 42,500. This area is now pivotal insofar as the short-term technical outlook is concerned.
By Fawad Razaqzada, market analyst with FOREX.com
Djia

DJIA H4 | Potential bullish reversalDJIA (US30) is falling towards a swing-low support and could potentially bounce off this level to climb higher.
Buy entry is at 42,779.36 which is a swing-low support that aligns with the 38.2% Fibonacci retracement level.
Stop loss is at 42,320.30 which is a level that lies underneath an overlap support and the 23.6% and 61.8% Fibonacci retracement levels.
Take profit is at 43,369.56 which is a swing-high resistance at the all-time high.
High Risk Investment Warning
Trading Forex/CFDs on margin carries a high level of risk and may not be suitable for all investors. Leverage can work against you.
Stratos Markets Limited (www.fxcm.com):
CFDs are complex instruments and come with a high risk of losing money rapidly due to leverage. 64% of retail investor accounts lose money when trading CFDs with this provider. You should consider whether you understand how CFDs work and whether you can afford to take the high risk of losing your money.
Stratos Europe Ltd (www.fxcm.com):
CFDs are complex instruments and come with a high risk of losing money rapidly due to leverage. 66% of retail investor accounts lose money when trading CFDs with this provider. You should consider whether you understand how CFDs work and whether you can afford to take the high risk of losing your money.
Stratos Trading Pty. Limited (www.fxcm.com):
Trading FX/CFDs carries significant risks. FXCM AU (AFSL 309763), please read the Financial Services Guide, Product Disclosure Statement, Target Market Determination and Terms of Business at www.fxcm.com
Stratos Global LLC (www.fxcm.com):
Losses can exceed deposits.
Please be advised that the information presented on TradingView is provided to FXCM (‘Company’, ‘we’) by a third-party provider (‘TFA Global Pte Ltd’). Please be reminded that you are solely responsible for the trading decisions on your account. There is a very high degree of risk involved in trading. Any information and/or content is intended entirely for research, educational and informational purposes only and does not constitute investment or consultation advice or investment strategy. The information is not tailored to the investment needs of any specific person and therefore does not involve a consideration of any of the investment objectives, financial situation or needs of any viewer that may receive it. Kindly also note that past performance is not a reliable indicator of future results. Actual results may differ materially from those anticipated in forward-looking or past performance statements. We assume no liability as to the accuracy or completeness of any of the information and/or content provided herein and the Company cannot be held responsible for any omission, mistake nor for any loss or damage including without limitation to any loss of profit which may arise from reliance on any information supplied by TFA Global Pte Ltd.
The speaker(s) is neither an employee, agent nor representative of FXCM and is therefore acting independently. The opinions given are their own, constitute general market commentary, and do not constitute the opinion or advice of FXCM or any form of personal or investment advice. FXCM neither endorses nor guarantees offerings of third-party speakers, nor is FXCM responsible for the content, veracity or opinions of third-party speakers, presenters or participants.

Update to Dow Jones Industrials Time At Mode Back in 2015 I had published a chart with annual data for the Dow Jones Industrials. I will provide a link at the bottom.
The research for this patterning is something I did myself by hand using pencil and paper back in the 1980's. These patterns show up in all time frames.
There is plenty of room to enhance the research on this technique and a group of us gather in the chat rooms here at TradingView to discuss new trades that set up and point out when trades expire.
Notice how these two grey boxes (which are both 50% drops in price) that expand wider in time from the 1960's to the 1980's and the 2000-2010's had a multi-year trend, followed by a monster crash (1987 was 40% and 2000 was 37%) and then just two+ years later there was a secondary bear market of 20% in 1990 and 22% in 2022. Keep in mind this is just for the DJ:DJI and not the Nasdaq Composite or S&P500 which were greater corrections.
The 11-year time frame of the 1999-2011 pattern allows for an 11-year rally from 2012 (which was year 1 of the 11-year rally) shows that time expired. As you can see from the 1943-1962 trend, a smaller 5-year mode formed at the end of the 20 year trend and then the market peaked in 1972-1973 when time expired for the second, smaller mode.
I had to reconstruct this chart after the data for the previous chart changed symbol. See the link below to see the original.
I look forward to your additional research onto this pattern and its implications to the idea that we are in a similar period to 1993-1994 with rally years of 1996, 1997, 1998, 1999 and 2000 ahead of us.
All the best,
Tim
October 19, 2024 3:31PM EST

[Bearish] SPX and DJI formed rising wedgesBoth OANDA:SPX500USD and TVC:DJI have formed rising wedge pattern which is bearish in nature. If they breakdown from this structure then we should see around 10% fall from current levels. More details in the video.

Is the Dow's Relentless Rise a Harbinger of Future Fortune or a In an era of unprecedented market dynamics, the Dow Jones Industrial Average (DJIA) has embarked on a journey of remarkable consistency, painting a picture of resilience that challenges historical norms. With a win rate approaching 61% over the past 250 trading days and impressive gains across multiple time frames, the Dow's current momentum stands as a testament to the market's enduring strength. This rare confluence of positive indicators places the present rally in the top echelons of market performances since 1900, excluding the tech bubble of 1995-2000.
Yet, as investors and analysts alike ponder the implications of this historic run, a question emerges: Does this exceptional momentum presage a continuation of bullish trends, or does it signal the approach of a market inflection point? Historical precedents offer a nuanced perspective, suggesting the potential for continued short-term gains while hinting at the possibility of increased volatility or stagnation in the longer term. The market's ability to sustain this momentum may hinge on factors as diverse as global economic conditions and the transformative potential of emerging technologies like artificial intelligence.
As we stand at this crossroads of market history, investors are challenged to look beyond the surface-level exuberance and delve deeper into the complexities of market cycles and technological revolutions. The Dow's current trajectory invites us to consider not just the immediate opportunities but also the broader implications for portfolio strategies and risk management in an ever-evolving financial landscape. In navigating these uncharted waters, wisdom lies in balancing optimism with prudence, recognizing that in the dance of market forces, momentum is but one partner in a complex choreography of factors shaping our financial future.

DJIA H4 | Falling to multi-swing-low supportDJIA (US30) is falling towards a multi-swing-low support and could potentially bounce off this level to climb higher.
Buy entry is at 41,966.98 which is a multi-swing-low support.
Stop loss is at 41,400.00 which is a level that lies underneath an overlap support and the 38.2% Fibonacci retracement level.
Take profit is at 42,720.14 which is a swing-high resistance.
High Risk Investment Warning
Trading Forex/CFDs on margin carries a high level of risk and may not be suitable for all investors. Leverage can work against you.
Stratos Markets Limited (www.fxcm.com):
CFDs are complex instruments and come with a high risk of losing money rapidly due to leverage. 62% of retail investor accounts lose money when trading CFDs with this provider. You should consider whether you understand how CFDs work and whether you can afford to take the high risk of losing your money.
Stratos Europe Ltd (www.fxcm.com):
CFDs are complex instruments and come with a high risk of losing money rapidly due to leverage. 59% of retail investor accounts lose money when trading CFDs with this provider. You should consider whether you understand how CFDs work and whether you can afford to take the high risk of losing your money.
Stratos Trading Pty. Limited (www.fxcm.com):
Trading FX/CFDs carries significant risks. FXCM AU (AFSL 309763), please read the Financial Services Guide, Product Disclosure Statement, Target Market Determination and Terms of Business at www.fxcm.com
Stratos Global LLC (www.fxcm.com):
Losses can exceed deposits.
Please be advised that the information presented on TradingView is provided to FXCM (‘Company’, ‘we’) by a third-party provider (‘TFA Global Pte Ltd’). Please be reminded that you are solely responsible for the trading decisions on your account. There is a very high degree of risk involved in trading. Any information and/or content is intended entirely for research, educational and informational purposes only and does not constitute investment or consultation advice or investment strategy. The information is not tailored to the investment needs of any specific person and therefore does not involve a consideration of any of the investment objectives, financial situation or needs of any viewer that may receive it. Kindly also note that past performance is not a reliable indicator of future results. Actual results may differ materially from those anticipated in forward-looking or past performance statements. We assume no liability as to the accuracy or completeness of any of the information and/or content provided herein and the Company cannot be held responsible for any omission, mistake nor for any loss or damage including without limitation to any loss of profit which may arise from reliance on any information supplied by TFA Global Pte Ltd.
The speaker(s) is neither an employee, agent nor representative of FXCM and is therefore acting independently. The opinions given are their own, constitute general market commentary, and do not constitute the opinion or advice of FXCM or any form of personal or investment advice. FXCM neither endorses nor guarantees offerings of third-party speakers, nor is FXCM responsible for the content, veracity or opinions of third-party speakers, presenters or participants.

DJIA H1 | Potential bullish bounce off overlap supportDJIA (US30) is trading close to an overlap support and could potentially bounce off this level to climb higher.
Buy entry is at 42,337.84 which is an overlap support that aligns with the 50.0% Fibonacci retracement level.
Stop loss is at 42,100.00 which is a level that lies underneath a pullback support and the 61.8% Fibonacci retracement level.
Take profit is at 42,720.14 which is a swing-high resistance at the all-time high.
High Risk Investment Warning
Trading Forex/CFDs on margin carries a high level of risk and may not be suitable for all investors. Leverage can work against you.
Stratos Markets Limited (www.fxcm.com):
CFDs are complex instruments and come with a high risk of losing money rapidly due to leverage. 62% of retail investor accounts lose money when trading CFDs with this provider. You should consider whether you understand how CFDs work and whether you can afford to take the high risk of losing your money.
Stratos Europe Ltd (www.fxcm.com):
CFDs are complex instruments and come with a high risk of losing money rapidly due to leverage. 59% of retail investor accounts lose money when trading CFDs with this provider. You should consider whether you understand how CFDs work and whether you can afford to take the high risk of losing your money.
Stratos Trading Pty. Limited (www.fxcm.com):
Trading FX/CFDs carries significant risks. FXCM AU (AFSL 309763), please read the Financial Services Guide, Product Disclosure Statement, Target Market Determination and Terms of Business at www.fxcm.com
Stratos Global LLC (www.fxcm.com):
Losses can exceed deposits.
Please be advised that the information presented on TradingView is provided to FXCM (‘Company’, ‘we’) by a third-party provider (‘TFA Global Pte Ltd’). Please be reminded that you are solely responsible for the trading decisions on your account. There is a very high degree of risk involved in trading. Any information and/or content is intended entirely for research, educational and informational purposes only and does not constitute investment or consultation advice or investment strategy. The information is not tailored to the investment needs of any specific person and therefore does not involve a consideration of any of the investment objectives, financial situation or needs of any viewer that may receive it. Kindly also note that past performance is not a reliable indicator of future results. Actual results may differ materially from those anticipated in forward-looking or past performance statements. We assume no liability as to the accuracy or completeness of any of the information and/or content provided herein and the Company cannot be held responsible for any omission, mistake nor for any loss or damage including without limitation to any loss of profit which may arise from reliance on any information supplied by TFA Global Pte Ltd.
The speaker(s) is neither an employee, agent nor representative of FXCM and is therefore acting independently. The opinions given are their own, constitute general market commentary, and do not constitute the opinion or advice of FXCM or any form of personal or investment advice. FXCM neither endorses nor guarantees offerings of third-party speakers, nor is FXCM responsible for the content, veracity or opinions of third-party speakers, presenters or participants.

DJIA H1 | Potential bullish breakoutDJIA (US30) is rising towards a potential breakout level and could climb higher from here.
Buy entry is at 42,200.56 9 (at market) which is a potential breakout level.
Stop loss is at 41,890.00 which is a level that lies underneath a swing-low support and the 50.0% Fibonacci retracement level.
Take profit is at 42,661.89 which is a level that aligns with the 78.6% Fibonacci projection level.
High Risk Investment Warning
Trading Forex/CFDs on margin carries a high level of risk and may not be suitable for all investors. Leverage can work against you.
Stratos Markets Limited (www.fxcm.com):
CFDs are complex instruments and come with a high risk of losing money rapidly due to leverage. 62% of retail investor accounts lose money when trading CFDs with this provider. You should consider whether you understand how CFDs work and whether you can afford to take the high risk of losing your money.
Stratos Europe Ltd (www.fxcm.com):
CFDs are complex instruments and come with a high risk of losing money rapidly due to leverage. 59% of retail investor accounts lose money when trading CFDs with this provider. You should consider whether you understand how CFDs work and whether you can afford to take the high risk of losing your money.
Stratos Trading Pty. Limited (www.fxcm.com):
Trading FX/CFDs carries significant risks. FXCM AU (AFSL 309763), please read the Financial Services Guide, Product Disclosure Statement, Target Market Determination and Terms of Business at www.fxcm.com
Stratos Global LLC (www.fxcm.com):
Losses can exceed deposits.
Please be advised that the information presented on TradingView is provided to FXCM (‘Company’, ‘we’) by a third-party provider (‘TFA Global Pte Ltd’). Please be reminded that you are solely responsible for the trading decisions on your account. There is a very high degree of risk involved in trading. Any information and/or content is intended entirely for research, educational and informational purposes only and does not constitute investment or consultation advice or investment strategy. The information is not tailored to the investment needs of any specific person and therefore does not involve a consideration of any of the investment objectives, financial situation or needs of any viewer that may receive it. Kindly also note that past performance is not a reliable indicator of future results. Actual results may differ materially from those anticipated in forward-looking or past performance statements. We assume no liability as to the accuracy or completeness of any of the information and/or content provided herein and the Company cannot be held responsible for any omission, mistake nor for any loss or damage including without limitation to any loss of profit which may arise from reliance on any information supplied by TFA Global Pte Ltd.
The speaker(s) is neither an employee, agent nor representative of FXCM and is therefore acting independently. The opinions given are their own, constitute general market commentary, and do not constitute the opinion or advice of FXCM or any form of personal or investment advice. FXCM neither endorses nor guarantees offerings of third-party speakers, nor is FXCM responsible for the content, veracity or opinions of third-party speakers, presenters or participants.

DOW JONES shows no signs of slowing down.Those of you who are worried if the upcoming November U.S. Presidential Elections or medium-term pull-backs (such as those of July and April 2024 or August - October 2023), pose a threat to your investments, you have a strong reason to relax and feel safe and that is the current chart.
On this 1M time-frame analysis, we see Dow Jones (DJI) in almost the past 30 years (since late 1997) and the Cycles that have defined its Tops and Bottoms. As you can see, initially there is a clear (green) Channel Up that is always trading above the 1M MA50 (blue trend-line), leading to the eventual Top, which in turn initiates the Bear Cycle (red Arc).
The use of the Sine Waves make a great fit for the bottoms in particular. It is interesting to mention that the time period between the end of each (green) Channel Up and the start of the next one is approximately 40 months (3.3 years). Also since the 2008 Housing Crisis, we can see that a wide Channel Up has been the dominant pattern driving the expansion of Dow.
With the above information in mind, we can reach the conclusion that the index is only now entering that aggressive green Channel Up of the Bull Cycle, meaning that the Cycle is far from over and if anything, we are approaching its middle. In fact, the 3.3 year (40 month) time gap has just been completed, so there is a full Channel Up expansion ahead of us.
Now, how high can that get? Well if each Bullish Leg of the 2008 emerged Channel Up is 40% less than the previous, then we are looking for at least a +100% rise from the September 2022 bottom, giving us a rough 57000 Target on a 5-year horizon. Again that doesn't mean that we won't have medium-term pull-backs (like those mentioned in the opening paragraph) along the way, they are necessary and they reset the prices in order to attract more liquidity and investors, but on the long run you can feel comfortable holding your stocks.
-------------------------------------------------------------------------------
** Please LIKE 👍, FOLLOW ✅, SHARE 🙌 and COMMENT ✍ if you enjoy this idea! Also share your ideas and charts in the comments section below! This is best way to keep it relevant, support us, keep the content here free and allow the idea to reach as many people as possible. **
-------------------------------------------------------------------------------
💸💸💸💸💸💸
👇 👇 👇 👇 👇 👇

Single digit correction is about to start till electionA single digit% correction is going to start from Mon or Tue till the presidential election.

SP500 Futures Chart Now in Final Stages of 100 year RallyCycles are a normal part of life. The stock market is no different. In my long term analysis we appear to be headed up to an area that can complete a rally that started almost 100 years ago.
For context, this long-term consolidation will be similar to Japan's Nikkei index in which made no new high's for 34 years.

DOW JONES Is a post Fed decline valid before an October rally?The day has come when the Fed will finally cut the Interest Rates for the first time since the early 2022 hike cycle and the question in the market is whether it will be by -0.25% or -0.5%.
High volatility is expected intra-day but technically Dow Jones (DJI) remains within an uptrend (Channel Up) both medium-term (5-months) and long-term (2 years). The last support and bounce was offered by the 1D MA50 (blue trend-line) on September 11 and that broke the remarkable symmetry that the index had so far with the March - August 2023 fractal.
That fractal suggested that after a (dotted) Channel Up, the index should make a correction below the 1D MA200 (orange trend-line) but on September 11 instead of breaking below the 1D MA50, the index rebounded (as mentioned above) and diverged from the fractal.
This means that the Bullish Led (green Channel Up) may this time start earlier and the rally may break above the 2-year Channel Up and finally deliver a new long-term pattern, possibly more aggressive.
Seasonality however is a big factor for investors and as we can see, the last two Septembers (2023, 2022) have been bearish, extending corrections that started in August but eventually managed to price a bottom in October.
As a result, any remark by Chair Powell during the press conference that isn't well received by the market, can initiate a short-term pull-back towards the 1D MA200, ranging from -5.07% to -6.90%.
In our opinion, if that takes place, it will be a tremendous buy opportunity until at least the end of the year. If however Powell delivers what the market is expecting (and more), we expect the pattern to continue its divergence from the 2023 fractal and enter the more aggressive bullish pattern earlier. If the more aggressive pattern prevails, a 46000 target is very probable by the end of the year.
Notice that this divergence is also evident when comparing the 1D RSI sequences of the two fractals.
-------------------------------------------------------------------------------
** Please LIKE 👍, FOLLOW ✅, SHARE 🙌 and COMMENT ✍ if you enjoy this idea! Also share your ideas and charts in the comments section below! This is best way to keep it relevant, support us, keep the content here free and allow the idea to reach as many people as possible. **
-------------------------------------------------------------------------------
💸💸💸💸💸💸
👇 👇 👇 👇 👇 👇

US30 (Log Chart)- firstly i want to explain what is US30, you can google it :
- US30 is a stock market index designed to measure the performance of 30 large industrial companies based on the average stock price of the components "during a specified period".
- So basically...when u have a Top30, if one company fail, this company is replaced by number 31.
- it's same in football or tennis, if you are in the top30 and u fail to win, you lose your rank and down to 31 right? Then u are not in Top30 anymore ?
- So you are replaced in the Top30 list (but sport is not a Ponzi, it's a real effort to be on the Top of the chain).
- Just made this text to explain how a big Ponzi works.
- Companies in US30 are not Ponzi because they work hard to stay in the Top30.
- but in matter of " Efforts", if you have the power to create your own money, you can do everything, and also buy your own stocks.
- Hope u get it.
- So when i read some peoples speak Bitcoin is a Ponzi, it makes me smile.
- it's clear that they didn't read at all Satoshi's White paper, or they are hypocritical.
--------------------------------------------------------------------------------------------------------------------------------------
- Thirteen years ago today, Satoshi released the Bitcoin genesis block - block 0.
- Embedded in it was a quote, “The Times 03/Jan/2009 Chancellor on brink of second bailout for banks".
--------------------------------------------------------------------------------------------------------------------------------------
To be a precursor, you need to know the future, Satoshi knew the future.
--------------------------------------------------------------------------------------------------------------------------------------
- So let's back to the chart :
- from 2009 to 2020. 11 years. DowJones was just perma bullish all the time with some small ridiculous dips.
- you can see how US30 Reacted during Covid worst pandemic situation in the world.
- after a fast dip in 2020 caused by Covid news.
- US30 went up for 672 days ( annotated in chart ) during a 2 years frustrating and painful lockdown.
- so it means those Top30 companies weren't affected by this pandemic situation.
- Really Weird.
- Actually imho, i think they were just preparing the actual dip, but this is just my own view.
- honestly, i just hope my US30 analysis fails.
- it would means that this time, governments are starting to be honest.
Happy Tr4Ding !

Combined US Indexes - Warning Trend Change to DOWNFrom the last post, there was a Gap closure and breakout... well, almost. What happened was a stall after the gap closure. This is the first indication that something is not right and a strong resistance is in the way.
After more than a week, a decisive down candle wiped out two prior days of bullish candles, and reopened the earlier gap. This by itself is very bearish... first on the candlestick pattern, and next on the reopening of the gap.
MACD have crossed under the signal line, in support of the bearish undertone.
Now, we wait for a full reopening of the gap, meaning a further breakdown of the supports.
By simple projection, the down wave from mid July to August (blue arrow) is projected from the last lower high in mid-August.
This brings the target to mid-September, at an old critical support level of 780.
Oddly enough, am expecting this to happen by the end of next week.

The economy peaked in April 2023"JOBS, JOBS, JOBS!"
As Obama said during the recovery period post GFC
This chart shows the employment level --- how many people are employed in the States / divided by the unemployment level --- the number of people without a job. .
A simple Ratio
With all the official Recessions highlighted in the red box.
The dates of the recessions are from Wikipedia.
JOBS are the ECONOMY
Goods and services are still made by people. (That is obviously under attack by robotics and AI) --- but will likely lead to new economies being birthed and new jobs created.
THE #FED is late to cut
and will likely cut too slowly
guaranteeing a GDP contraction therefore further job losses.
HOLDING RISK ASSETS
IS RISKY
needless to say.

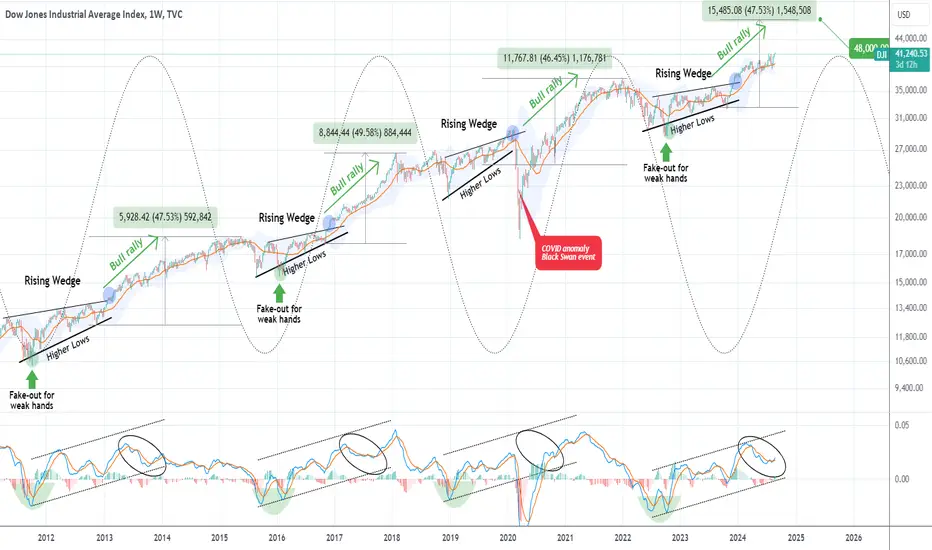
DOW JONES The pattern that never failed is now targeting 48000Dow Jones (DJI) gave us the best bullish break-out signal of the year 8 months ago (December 13 2023, see chart below), as our buy entry at 36577 is very close to hitting our 42900 Target:
At that time we made a clear point why that rally 'shouldn't surprise you' and now you see why. This 1W time-frame chart shows the cyclical behavior of the index, which peaks (Sine Wave top) then pulls back and starts forming a Rising Wedge (Sine Wave bottom) and when it breaks above the Rising Wedge, is where it flashed the bullish break-out signal we got back in December.
As you can see it then starts a gradual rise on the BB20 and completes the Cycle again (Sine Wave top) after roughly a +47% rally. The title mentions that this pattern 'never failed', in practice it only broke during the COVID flash crash, which is a non-technical event than occurs once every 100 years. As you can see even the 1W MACD sequences between the cyclical patterns are identical.
As a result, our Target towards the Sine Wave peak is 48000.
-------------------------------------------------------------------------------
** Please LIKE 👍, FOLLOW ✅, SHARE 🙌 and COMMENT ✍ if you enjoy this idea! Also share your ideas and charts in the comments section below! This is best way to keep it relevant, support us, keep the content here free and allow the idea to reach as many people as possible. **
-------------------------------------------------------------------------------
💸💸💸💸💸💸
👇 👇 👇 👇 👇 👇
Why the 'record high' on Dow Jones underwhelms...Another day, another record high for a US stock market. Only the one seen on the Dow Jones underwhelms given it is not backed up by its own futures market, let alone its peers. We're also approaching end-of-month flows (which can prompt fickle price action). And keep an eye on the Nvidia earnings report on Wednesday (US) which can single-handedly drive sentiment on Wall Street.

240823 Market Outlook $SPX $DJI $VOO $SPY $QQQChart S&P overlay Fed interest rate a few conclusions:
1. Stocks can rise and fall throughout rate cut cycle;
2. Rise in stocks is usually associated with minimum interest rate in the cycle;
3. US stocks were rising throughout rate hike cycle in later years;
4. More money supply management tools were introduced in last quarter century like QE policy;
5. More tools like Circuit Breaker were introduced to stop panic selling in US stocks since Financial crisis 2008;
6. The market has become more certain and efficient;
7. Investors must always recognize the market situation, cuz US management is research based and one cycle is different from another.
A new prosperous cycle is enact at the moment. Cheers

DJIA H4 | Heading into swing-high resistanceDJIA (US30) is rising towards a swing-high resistance and could potentially reverse off this level to drop lower.
Sell entry is at 41,032.64 which is a swing-high resistance.
Stop loss is at 41,523.00 which is a level that sits above a swing-high resistance at the all-time high.
Take profit is at 40,417.18 which is a pullback support.
High Risk Investment Warning
Trading Forex/CFDs on margin carries a high level of risk and may not be suitable for all investors. Leverage can work against you.
Stratos Markets Limited (www.fxcm.com):
CFDs are complex instruments and come with a high risk of losing money rapidly due to leverage. 68% of retail investor accounts lose money when trading CFDs with this provider. You should consider whether you understand how CFDs work and whether you can afford to take the high risk of losing your money.
Stratos Europe Ltd, previously FXCM EU Ltd (www.fxcm.com):
CFDs are complex instruments and come with a high risk of losing money rapidly due to leverage. 73% of retail investor accounts lose money when trading CFDs with this provider. You should consider whether you understand how CFDs work and whether you can afford to take the high risk of losing your money.
Stratos Trading Pty. Limited (www.fxcm.com):
Trading FX/CFDs carries significant risks. FXCM AU (AFSL 309763), please read the Financial Services Guide, Product Disclosure Statement, Target Market Determination and Terms of Business at www.fxcm.com
Stratos Global LLC (www.fxcm.com):
Losses can exceed deposits.
Please be advised that the information presented on TradingView is provided to FXCM (‘Company’, ‘we’) by a third-party provider (‘TFA Global Pte Ltd’). Please be reminded that you are solely responsible for the trading decisions on your account. There is a very high degree of risk involved in trading. Any information and/or content is intended entirely for research, educational and informational purposes only and does not constitute investment or consultation advice or investment strategy. The information is not tailored to the investment needs of any specific person and therefore does not involve a consideration of any of the investment objectives, financial situation or needs of any viewer that may receive it. Kindly also note that past performance is not a reliable indicator of future results. Actual results may differ materially from those anticipated in forward-looking or past performance statements. We assume no liability as to the accuracy or completeness of any of the information and/or content provided herein and the Company cannot be held responsible for any omission, mistake nor for any loss or damage including without limitation to any loss of profit which may arise from reliance on any information supplied by TFA Global Pte Ltd.
The speaker(s) is neither an employee, agent nor representative of FXCM and is therefore acting independently. The opinions given are their own, constitute general market commentary, and do not constitute the opinion or advice of FXCM or any form of personal or investment advice. FXCM neither endorses nor guarantees offerings of third-party speakers, nor is FXCM responsible for the content, veracity or opinions of third-party speakers, presenters or participants.

DOW JONES Don't lose sight of the great picture. Still bullish.Last week, while Dow Jones (DJI) was still under its 1D MA50, we called for a major rally, as technically the 5-month Channel Up has just priced its new Higher Low:
The index has now almost reached the Target of the first Bullish Leg of this pattern, pointing to a potential relief next.
On the larger picture however (1M time-frame), we had posted an article named 'Secret Cycles' on April 12 2024 (see chart below), during Dow Jones' previous pull-back that again inflicted fear in the markets, calling for a strong buy:
It is this chart that we revisit and expand up today, as we don't think the long-term trend has changed. We want to maintain a clear long-term perspective and following August's massive recovery 1M candle, we believe that Dow will enter by Q4 2024, the final stage (rally) of its current Cycle.
That has historically been 1 year at least, so as long as the index keeps holding and closing the monthly candles above the 1M MA50 (red trend-line), we will continue buying all monthly dips. Our 48850 long-term Target is intact.
-------------------------------------------------------------------------------
** Please LIKE 👍, FOLLOW ✅, SHARE 🙌 and COMMENT ✍ if you enjoy this idea! Also share your ideas and charts in the comments section below! This is best way to keep it relevant, support us, keep the content here free and allow the idea to reach as many people as possible. **
-------------------------------------------------------------------------------
💸💸💸💸💸💸
👇 👇 👇 👇 👇 👇

$DJT is almost ready to break above the LT bull flagLat week NASDAQ:DJT approached again to a long-term upside resistance bull flag line 15800 level. A break above this level will lead to a strong bull market continuation and this is also bullish for all the Indices and US stocks market as well.

DJIA Back Above 40K - Record Highs in Sight?The Dow Jones Industrial Average is rallying again today after strong retail sales and jobless claims data alleviated recession concerns.
The 30-stock index has now re-established itself above the psychologically-significant 40K level, opening the door for a bullish continuation toward the record highs near 41,250 next.
As long as 40K holds, the technical bias in the index will remain to the topside.
-MW

US30 H4 | Overlap resistance at 78.6% Fibonacci retracementUS30 is rising towards an overlap resistance and could potentially reverse off this level to drop lower.
Sell entry is at 40,516.27 which is an overlap resistance that aligns close to the 78.6% Fibonacci retracement level.
Stop loss is at 41,280.00 which is a level that sits above a swing-high resistance.
Take profit is at 39,974.82 which is a pullback support.
High Risk Investment Warning
Trading Forex/CFDs on margin carries a high level of risk and may not be suitable for all investors. Leverage can work against you.
Stratos Markets Limited (www.fxcm.com):
CFDs are complex instruments and come with a high risk of losing money rapidly due to leverage. 68% of retail investor accounts lose money when trading CFDs with this provider. You should consider whether you understand how CFDs work and whether you can afford to take the high risk of losing your money.
Stratos Europe Ltd, previously FXCM EU Ltd (www.fxcm.com):
CFDs are complex instruments and come with a high risk of losing money rapidly due to leverage. 73% of retail investor accounts lose money when trading CFDs with this provider. You should consider whether you understand how CFDs work and whether you can afford to take the high risk of losing your money.
Stratos Trading Pty. Limited (www.fxcm.com):
Trading FX/CFDs carries significant risks. FXCM AU (AFSL 309763), please read the Financial Services Guide, Product Disclosure Statement, Target Market Determination and Terms of Business at www.fxcm.com
Stratos Global LLC (www.fxcm.com):
Losses can exceed deposits.
Please be advised that the information presented on TradingView is provided to FXCM (‘Company’, ‘we’) by a third-party provider (‘TFA Global Pte Ltd’). Please be reminded that you are solely responsible for the trading decisions on your account. There is a very high degree of risk involved in trading. Any information and/or content is intended entirely for research, educational and informational purposes only and does not constitute investment or consultation advice or investment strategy. The information is not tailored to the investment needs of any specific person and therefore does not involve a consideration of any of the investment objectives, financial situation or needs of any viewer that may receive it. Kindly also note that past performance is not a reliable indicator of future results. Actual results may differ materially from those anticipated in forward-looking or past performance statements. We assume no liability as to the accuracy or completeness of any of the information and/or content provided herein and the Company cannot be held responsible for any omission, mistake nor for any loss or damage including without limitation to any loss of profit which may arise from reliance on any information supplied by TFA Global Pte Ltd.
The speaker(s) is neither an employee, agent nor representative of FXCM and is therefore acting independently. The opinions given are their own, constitute general market commentary, and do not constitute the opinion or advice of FXCM or any form of personal or investment advice. FXCM neither endorses nor guarantees offerings of third-party speakers, nor is FXCM responsible for the content, veracity or opinions of third-party speakers, presenters or participants.
