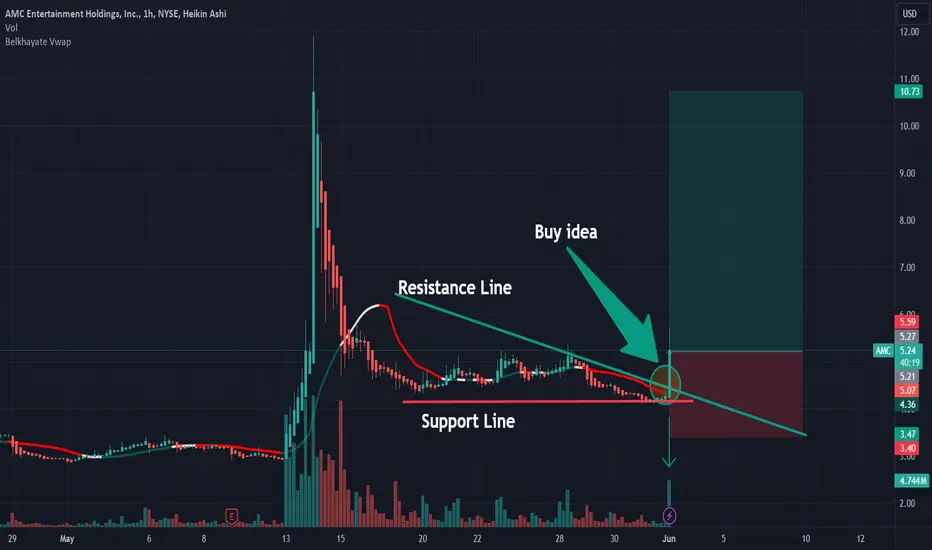
AMC: Buy idea Buy idea on AMC as you see on the chart after the breakout with force the vwap and the resistance line by a big green candle follow by a large green volume.!
The Epic GameStop Saga: How Retail Traders Toppled Hedge FundsThe story of GameStop (GME) and Wall Street Bets is one for the history books. 🏆 This tale of David vs. Goliath saw everyday retail traders take on some of the most powerful hedge funds on Wall Street, and win—at least for a while. Let's dive into this rollercoaster of financial drama, where memes, emojis, and Reddit posts became weapons of choice.
The Rise of the Retail Trader 💪
It all started on a subreddit called Wall Street Bets (WSB), where a group of retail traders noticed something peculiar about GameStop. Hedge funds like Melvin Capital were heavily shorting the stock, betting that its price would fall. But the WSB community saw an opportunity. By banding together, they could drive up the stock price, forcing the hedge funds to buy back shares at higher prices to cover their shorts—a process known as short covering.
Short Covering Explained 🧠
For the uninitiated, short covering happens when traders who have shorted a stock (sold it hoping to buy it back at a lower price) must buy back shares as the price rises, to limit their losses. This buying pressure can further drive up the stock price, creating a feedback loop of rising prices and more buying.
The Showdown 🥊
In January 2021, the WSB crowd launched their coordinated buying spree, and GameStop's stock price skyrocketed from around $20 to a peak of $483. Hedge funds were caught off guard. Melvin Capital, one of the primary short-sellers, faced massive losses. Enter Citadel, a large hedge fund, which stepped in to bail out Melvin Capital with a hefty cash infusion. But the damage was done. Retail traders had won a significant battle, showcasing their power to move markets.
Fast Forward to Today ⏩
Fast forward to today, and the GameStop frenzy has simmered down, but the stock's legacy remains. Currently, the sentiment around GameStop is neutral. The put/call ratio, a measure of market sentiment, indicates that traders are neither overwhelmingly bullish nor bearish. They're getting out of the stock, which reflects a stabilizing interest.
GameStop's price has recently dipped below a monthly supply zone of $40 per share, signaling a critical point in its trading activity. However, there's significant buying interest at around $10 per share. This suggests that if the stock drops to this level, we might see renewed buying activity.
What’s Next? 📅
Looking ahead, GameStop's earnings report on June 11th will be crucial. Investors and traders alike will be watching closely to see how the company is performing financially. This report could either stabilize the stock or create new waves of volatility.
The Legacy 🌟
The GameStop saga is more than just a story about stock prices. It's about the power of the collective, the impact of social media on financial markets, and the democratization of trading. Retail traders showed that they could band together and challenge the titans of Wall Street. And they did it with a sense of humor, using memes and emojis to rally the troops.
So, what's the takeaway? Whether you're a retail trader or a hedge fund manager, the GameStop episode is a reminder that in the stock market, anything can happen. And sometimes, the little guys can win big. 🚀💥

ADANI PORTS - Ready to Move to next upper Trajectory?The stock on its upper trajectory faced a price rejection around 1425 levels and it was driven down to below the 50 DMA levels. From there it took support and then started recovering. Recently there was an attempt to take out the price rejection zone but that move did not succeed and it was pushed back to test the price rejection zone. Now it is again attempting to take out the rejection zone. We can see increasing momentum and also the relative strength is positive. The money flow needs to become positive. We can see some increase in the volume as well. Now this stock is likely to succeed in taking out the rejection zone. A good close above 1457 would take it to the next upper trajectory.

Can Roaring Kitty and WSB team push Gamestop to $184If u copy the price range #1
and add it to the high of 2008
We get a log price #2
This could be useful to have some insight to where #GME could possibly go if things go crazy!
And it not only challenged it's ATH but goes on into blue sky territory.
This is also extremely bullish for #crypto and #shitcoins
Wild Degeneracy breeds FoMO and creates giant green candles where don't expect them
#Memecoins


5-Year Opportunity to 20x Your Money in 400 Days?Novavax, Inc. (NVAX) has recently bounced off a 5-year support line, potentially paving the way for a bullish move that could yield a 2,000% profit. 🚀
- The RCI 3 line indicator shows a bullish crossing of the middle and long trend lines.
- The RSI spiked above the moving average.
- A rare bullish signal has appeared below the chart. The last time this happened was in December 2019, before a strong bull run.
If history repeats itself, a profit of 20 times your money in 400 days is possible.
What do you think?

GME (Gamestop) - The Markets Most Underestimated CompanyGamestop is NOT a brick & mortar store.
Gamestop is a Tech company.
Throughout history it has always been Gaming & Arts that have driven the adoption of new technologies and inspired new communities by pushing the boundaries of imagination.
GameStop has cemented itself as a pioneer by becoming the first household name to embrace blockchain technology and explore the realms of Web3 Gaming, NFT's & Crypto.
Web3, NFT's & Crypto empower creators & gamers allowing them to participate in the development of the metaverse where they can share & exchange their in-game assets.
NFT's allow for verifiable ownership of in-game assets which opens doors for gamers to monetize the time they put into gaming and create markets for their in-game assets.
----
Lets use Call of Duty as an example.
A game filled with all kinds of weapons & different levels of power & accuracy.
Imagine if there was a gun that had 100% accuracy & 100% power from any distance.
Now imagine if there was only 10 verifiable copies of this gun in the game.
How much is this gun worth?
Now lets assume a viral streamer like Ninja were to own a copy of this gun.
How much is this gun worth now?
Answer : A lot.
---
GameStop is positioned at the front line of this movement and has sparked a massive wave of innovation encouraging companies & gamers to explore new possibilities that will transform the gaming industry and force other companies to adapt or be left behind.
I repeat
Gamestop is a Tech Company.

Why bullish on GME?NYSE:GME 1.Fibannacci Retracement give us a price of 510$ per share in the all monthly chart.
2.Even with this move at 80$ the EMA CROSS SLOPE did not show us the long+2 signal.
3.MACD has crossed with a green buying singal and an uptrend verifacation
4.RSI at the lows with a revelsal forward to potential buying pressure
5. 2BILLION in the bank
6.25% locked and DRSED
7.Insiders buying and not selling
8. DFV THESIS
9.potential digital transformation of the company
10. PROVED WRONG SHORT THESIS.
These ten reasons are enough to just be BULLIsh on GME
Thats my hummble opinion and of cource its not any financial advise.
ANYWAY MARKET SEEMS TO BE BULLISH....CRAZY BUT IT IS INSTEAD! NYSE:GME

Using Fib Retracement as a Bullish Signal for Vistra StockUsing a very simple fib retracement indicator, there is potential for longs here for Vistra. It has been in a consistent uptrend, bouncing off fib support lines. Needs to break resistance line it tested at $108. I think it will soon. Next price target: $110

TSLA GANN ProjectionsSince the peak, i've constructed a Gann square using time cycles derived from price, the 50 % of the all time high price level of 207 gets visited often during these cycles. A confluence of Gann angles on the squares and time cycles are pointing to the week of June 10th, 2024 as possibly retesting the 207 area in an attempt to make a first higher high on the weekly chart.

AMD will be bullishA great status with monthly FRACTAL confirmation ...
My first target is $280 and the rest will be History ...

META : Sideways Trend Key Points : NASDAQ:META
1. A symmetrical triangle chart pattern is a period of consolidation,
2. A breakdown from the lower trend line marks the start of a new bearish trend.
3. A breakout from the upper trend line indicates the beginning of a new bullish trend
Resistance - 480
Support - 462
If you need further analysis, please don’t hesitate to reach out. Feel free to contact me if you have any questions or concerns. If I can help in any way, please don’t hesitate to ask.

June 2: Downside to correct Oct 2022 rallyNYSE:DELL in Monthly finished May with a big red candle on high volume below the channel. The May top combined with a huge drop with bearish RSI divergence on the weekly increases the possibility that it was a climax top and the 5-wave rally from Oct 2022 has finished. The gap left on the monthly is another clue that the last run to the May top was an exhaustion gap and would be a magnet for the pull back to retest the 100 psychological level.

APPLE: Bearish Continuation & Short Trade
APPLE
- Classic bearish setup
- Our team expects bearish continuation
SUGGESTED TRADE:
Swing Trade
Short APPLE
Entry Point - 192.38
Stop Loss - 196.72
Take Profit - 184.49
Our Risk - 1%
Start protection of your profits from lower levels
❤️ Please, support our work with like & comment! ❤️

RVNLLooks good on Chart.
Breakout possible.
Long Consolidation done.
Above all EMA.
Good for Short term.
Do Like ,Comment , Follow for regular Updates...
Keep Learning ,Keep Earning...
Disclaimer : This is not a Buy or Sell recommendation. I am not SEBI Registered. Please consult your financial advisor before making any investments . This is for Educational purpose only.

ADANI ENERGY SOLUTIONS LIMITED : ADANENSOL will go to 2000?Rest everything else is mentioned in the chart kindly check.

Important section: 1071.36-1130.53Hello, traders.
If you "Follow", you can always get new information quickly.
Please click "Boost" as well.
Have a nice day today.
-------------------------------------
(1M chart)
The key is whether the price can be maintained by rising above the Fibonacci ratio 3.618 (1135.97), which is the peak of the major uptrend.
If not, it is expected to form a downtrend and form a new trend.
(1W chart)
The Fibonacci ratio on the right is shown in the major uptrend.
The Fibonacci ratio on the left is shown in the recent uptrend on the 1W chart.
Accordingly, if the price is maintained above the right Fibonacci ratio 3.618 (1135.97), it is expected to rise to the left Fibonacci ratio 1 (1339.36).
The important section on the 1W chart is around 848.46.
Accordingly, if it fails to rise above 1130.53, it should check for support near 848.46.
The rising channel indicated by the circle is a trend line connected between lows.
Therefore, if it cannot rise within the current rising channel, the key is whether it rises along the rising channel between lows indicated by the circle.
(1D chart)
The HA-High indicator on the 1D chart is showing signs of being created at the 1071.36 point.
Accordingly, the important section on the 1D chart is around 1071.36.
Therefore, the section 1071.36-1130.53 is the important section.
This volatility period is around June 4th (June 3rd-5th).
Therefore, it is necessary to check in which direction it deviates from the section 1071.36-1130.53 after the volatility period.
Have a good time.
Thank you.
--------------------------------------------------
- Big picture
It is expected that a full-scale uptrend will start after it rises above 29K.
The section expected to touch in the next bull market is 81K-95K.
#BTCUSD 12M
1st: 44234.54
2nd: 61383.23
3rd: 89126.41
101875.70-106275.10 (overshooting)
4th: 13401.28
151166.97-157451.83 (overshooting)
5th: 178910.15
These are points where resistance is likely to occur in the future.
We need to check if these points can be broken upward.
We need to check the movement when this section is touched because I think a new trend can be created in the overshooting section.
#BTCUSD 1M
If the major uptrend continues until 2025, it is expected to start forming a pull back pattern after rising to around 57014.33.
1st: 43833.05
2nd: 32992.55
-----------------

IREDA - Head & Shoulder patternAll details are given on chart. If you like the analyses please do share it with your friends, like and follow me for more such interesting charts.
Disc - Am not a SEBI registered analyst. Please do your own analyses before taking position. Details provided on chart is only for educational purposes and not a trading recommendation

KNR CONSTRUCTION Looks Good on Monthly& weekly Time frame
Positional trade,
Target & SL are on charts.
* For education & backtesting Purpose only.

MOTHERSONWeekly close above the zone.
A perfect stock for short term
Disclaimer : This is not a Buy or Sell recommendation. Please consult your financial advisor before making any investments . This is for Educational purpose only

Nice entry point for PYPL Paypal - Long termPayPal was bearish since Sep 2021 till Oct 2023 (2 full years).
It seems like it has hit the bottom at $50 area, and now making a bullish trend (higher low, higher high).
It broke the down trend line from Aug 2022, and currently making a confirmation.
$63 price at the beginning of June 2024 is a good entry point for the long run with relatively short stop-loss (less than 5%)
Target points are as below:
6 months : +21%
1 year later : +48%
1.5 years later : +84%
2.5 years later : +175%
4 years later : +359%
So, we can check with PayPal every 0.5 year (6 months).
GL

PLTR big bullish move these coming weeks Weekly Chart Monthly chart is showing a strong monthly Break and retest of the Support/Resistance level.
Price has been struggling to push up from July 2023 to Feb 2024. And we see price finally breaking above S/R level with strong bullish momentum. Expected the price to come back down for a quick retest. Currently price is sitting on Support level with Month of May candle being a doji candle. Showing there is no selling pressure nor buying pressure. Waiting for the next big news event.
Going into the Weekly Chart, we can see a clear bullish structure. Price is making HH and HL.
Price has also pulled back correctively into 50-61.8 FIB.
We also have a bullish trendline. The third tap of the trendline usually always gives a strong momentum with the trend.
Confluence --
1. Break and Retest of Strong Monthly S/R
2. Weekly Chart shows bullish impulsive move followed by a corrective move into 50-61.8 FIB
3. Tapping into Strong bullish trendline.

MPSLTD indicating Increase in Strength by Breaking Trend LineCompany has reduced debt.
Company is almost debt free.
Company has a good return on equity (ROE) track record: 3 Years ROE 26.0%.
Company has been maintaining a healthy dividend payout of 39.7%.
Company's working capital requirements have reduced from 34.3 days to 10.4 days.
Reported
Revenue 545.3 Cr
Reported
Revenue YoY +++ 8.83 %
EBITDA +++ 169.9 CR
EBITDA Margin +++ 31.15 %
EPS Growth YoY +++ 9.61%
Tremendous Growth Opportunities
• Maximize cross-sell and upsell with captive customer
base of 750+ customers.
• Scale central growth and marketing engine to acquire
new customers and expand geographic footprint.
• Consistent investment and deployment of new
capabilities across lines of business.
• Enter adjacent markets by re-configuring
products/services.
• Play the role of a Consolidator in a highly fragmented
market.
MPS is a B2B learning and platform solutions company powering education, and research for corporates. MPS has unlocked a new growth trajectory due to the combined effect of lower attention spans, rapid growth in digital consumption, and the recent advances in AI/ML.
