Reliable Trend-Momentum Confluence [GPT-5] (BIGAL)I am tired of fake buy and sell alert charts ,I asked to my fellow AI friend for %99 accuracy not 100%
Breadth Indicators

💎 Trend Master Pro Scalping MTFTrend Master Pro Scalping MTF is a professional-grade indicator designed for intraday trading and scalping, optimized for 1M, 5M, and 15M timeframes. It combines multiple technical filters to provide high-confidence breakout and trend signals with visual clarity.
Key Features:
Multi-indicator analysis: EMA, RSI, ATR, SuperTrend, and volume.
Multi-Timeframe (MTF) filter: signals are validated only if the higher timeframe trend is aligned.
Clear visual signals: colored triangles and dynamic labels showing signal strength: A++, A+, A, B.
Confirmation dashboard: instantly see EMA trend, RSI strength, volume, ATR activity, SuperTrend direction, and final signal on your chart.
Reliable alerts: fixed alert messages compatible with TradingView, avoiding Pine Script errors.
Customizable parameters: adjust EMA, RSI, ATR, volume, and SuperTrend settings to match your scalping or day trading style.
How to Use:
Select your desired timeframe: 1M, 5M, or 15M.
Look for signals rated A++ or A+ for maximum probability.
Confirm trends using labels and the dashboard before entering trades.
Receive real-time notifications via alerts when confirmed signals occur.
Benefits:
Ideal for quick scalping and intraday strategies.
Reduces false signals with MTF trend filtering.
Professional visualization for fast and confident decision-making.
Recommendations:
Test on a demo account before trading live.
Adjust parameters to fit your asset and timeframe.
Combine with proper risk management strategies.

My Smart Volume Profile – Fixed
Title: 🔹 My Smart Volume Profile – Fixed
Description:
Lightweight custom Volume Profile showing POC, VAH, and VAL levels from recent bars. Highlights the value area, marks price touches, and supports optional alerts.
Developer Note:
Created with precision and simplicity by Magnergy


AUTO asset, 1h/4h, Last Lines + Alerts + Signal BoxUnified PC-ATR v5 (Indicator) — AUTO asset, 1h/4h, Last Lines + Alerts + Signal Box


Buy on Blue, Sell on Red (EMA + optional RSI) TyusEThis indicator is a trend-following system that helps traders identify potential buy and sell opportunities using a combination of EMA crossovers and an optional RSI filter for confirmation.
It plots:
🔵 Blue dots (BUY signals) when the fast EMA crosses above the slow EMA — signaling bullish momentum.
🔴 Red dots (SELL signals) when the fast EMA crosses below the slow EMA — signaling bearish momentum.
You can optionally filter these signals using the RSI (Relative Strength Index) to avoid false breakouts — for example, only taking BUY signals when RSI is above 55 (showing strength) and SELL signals when RSI is below 45 (showing weakness).
⚙️ Features
Adjustable Fast EMA and Slow EMA lengths
Optional RSI confirmation filter
Customizable RSI thresholds for entries
“Confirm on bar close” setting to reduce repainting
Built-in alert conditions for real-time notifications
💡 How to Use
Use blue dots as potential long entries and red dots as potential short entries.
Confirm direction with overall trend, structure, or higher timeframe alignment.
Combine with support/resistance, volume, or price action for best results.
⚠️ Note
This is a technical tool, not financial advice. Always backtest and use proper risk management before trading live markets.
T.E

DD RatioThe DD Ratio (“Directional Distribution Ratio”) is a breadth indicator that shows, in real time, how many of the selected stocks (e.g., S&P 500 components) are bullish vs. bearish relative to today’s open.
The DD Ratio tells you what’s really happening under the hood of the index:
Futures may mislead: An index future (like ES or NQ) can rise on a few heavy-weighted stocks even while most components fall.
The DD Ratio exposes that divergence.
Breadth confirmation: When the futures are up and DD Ratio ≥ 0.5 → healthy rally.
When futures are up but DD Ratio < 0.5 → weak, narrow advance.
Intraday sentiment gauge: It updates live with each bar, reflecting “who’s winning” since the open.


Addikro_V1📌 Description – Trend+Entry+Risk Indicator
This indicator combines statistically proven trading concepts into a complete trading framework:
✅ Trend Filter (EMA200)
All trades follow the higher-timeframe trend. Trend direction is clearly visualized.
✅ Entry Signals (you can choose):
EMA Crossover (EMA50 crossing EMA200) — classic trend-following entry
Breakout of recent highs/lows (20-bar range) — optionally only valid after a pullback to EMA50
✅ ATR-Based Risk Management:
Dynamic Stop Loss (SL) and Take Profit (TP1/TP2) levels using ATR
The last entry is saved — SL/TP lines stay visible on the chart
Optional position size suggestion based on % risk of account
✅ Smart Filters for Higher Accuracy:
RSI filter: e.g., only long if RSI > 50
Volume filter: signal only if volume is above SMA × multiplier
✅ Fixed Chart HUD (Table Overlay):
Displays live information anchored to the chart (does not move with candles)
Shows: Trend direction, entry mode, RSI, ATR, SL/TP multiplier, position size suggestion
Position can be set: top-left / top-right / bottom-left / bottom-right
✅ Signals & Alerts:
Visual arrows on the chart for long/short signals
Custom alert conditions included (works with mobile, email, webhook, bots)
🎯 Why this indicator works
It follows the same logic used by many successful systematic and hedge fund strategies:
Trend direction + statistically solid entries + strict risk management → no repainting, no guessing, no emotion.


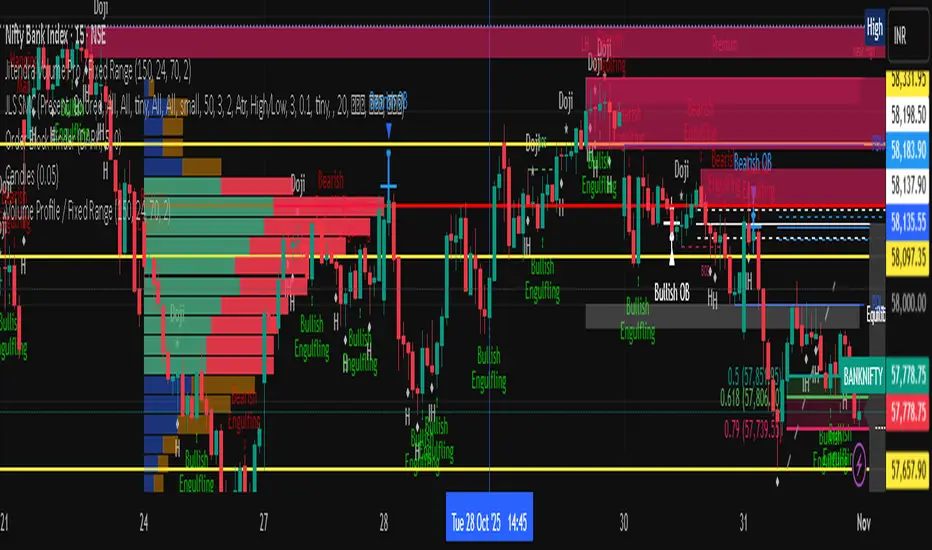
Jitendra Volume Pro / Fixed RangeHello All,
This script calculates and shows Volume Profile for the fixed range. Recently we have box.new() feature in Pine Language and it's used in this script as an example. Thanks to Pine Team and Tradingview!..
Sell/Buy volumes are calculated approximately!.
Options:
"Number of Bars" : Number of the bars that volume profile will be calculated/shown
"Row Size" : Number of the Rows
"Value Area Volume %" : the percent for Value Area
and there are other options for coloring and POC line style
Enjoy!
Jitendra Sankpal
Bull Run Galaxy
2.11.2025
MTF - Zones Scanner⚡ MTF Zones Scanner
- Smarter Multi-Timeframe Trading — Simplified.
💼 Ever wondered what tools Prop Desk Traders use?
You’ve just landed in the right place.
MTF Zones Scanner brings you the same level of structural clarity used in proprietary trading setups — combining multi-timeframe confluence and multiple reversal signal alignment in one elegant package.
📊 Spot market structure, zone strength, and breakout opportunities across multiple symbols — instantly.
Built for traders who demand clarity, context, and confidence — without unnecessary complexity.
🌍 One Dashboard. All Signals.
🔁 Multi-Timeframe Zone Mapping — View higher-timeframe zones directly on your working chart.
🧭 Smart Symbol Groups — Seamlessly monitor all 500 Nifty stocks, organized for maximum scanning efficiency.
⚙️ Continuous Background Monitoring — Even while you focus on one chart, the script quietly tracks every stock for possible breakouts or breakdowns.
🧩 Dynamic Confluence Engine — Detects when short- and long-term structures align for stronger setups.
🧠 Intelligent Scoring Model — Each symbol is automatically ranked by structural strength, momentum, and probability.
🚨 Group-Based Alerts — One alert fires when any stock in your selected group triggers a high-confidence breakout.
🕹️ Key Benefits
✅ Monitors the entire Nifty 500 universe automatically — no chart-hopping required.
✅ Instantly highlights stocks nearing key demand or supply zones.
✅ Adds higher-timeframe confirmation for cleaner entries & exits.
✅ Optimized for intraday and swing trading.
✅ Fully visual, customizable, and resource-efficient.
🧭 At a Glance
🔹 On-chart Zone Overlays highlight actionable areas.
🔹 Real-time Ranking Table shows your strongest setups.
🔹 Clear status icons:
🟢 Potential Buy Zone
🟣 Potential Sell Zone
⚪ Consolidation Watch
🟡 Breakout Detected
🔔 Unified Alert System
Forget juggling multiple alerts or scripts.
Whenever any stock in your chosen group confirms a breakout or breakdown with a strong score, you’ll instantly get:
TATASTEEL on 15 min → 🟢 Demand Breakout Detected
You don’t need to set 500 alerts — just 34 simple group alerts to cover the entire Nifty 500 universe.
The system handles everything else silently in the background.
Fully compatible with TradingView’s “Any alert() function call” — precise, real-time, and noise-free.
🧱 Built for Power Users
🕒 Works across all intraday & swing timeframes.
⚙️ Adjustable sensitivity, zone depth, and confluence strength.
🧩 Pre-loaded with the complete Nifty 500 list.
💻 Powered by Pine v6 for stable, efficient background scanning.
💡 Not from India? No Problem.
The indicator can be customized to scan any set of stocks — from any country or market worldwide.
Just get in touch with us, and we’ll build a custom version tailored to your needs.
💡 Who It’s For
Sector & positional traders managing wide watchlists.
Intraday traders looking for quick, high-confidence confirmations.
Analysts seeking multi-timeframe confluence across diverse markets.
✨ Why It Stands Out
🧭 Context + Clarity + Consolidation
Don’t react — anticipate.
MTF Zones Scanner constantly interprets market structure so you can focus on decisive, high-probability setups across every stock you follow.
A professional-grade, Prop-Desk-style multi-timeframe scanner that filters noise, reveals structure, and surfaces opportunities — automatically.
🛡️ Proprietary Technology Notice
The analytical framework of MTF Zones Scanner is proprietary and confidential.
It blends multiple quantitative and contextual models into a single actionable output — keeping your edge intact.
🎁 Get Connected for 1-Month Free Trial →
Experience the power of real-time, all-market awareness.
🔗 Start Your Free Trial Today — and Trade Smarter Now.

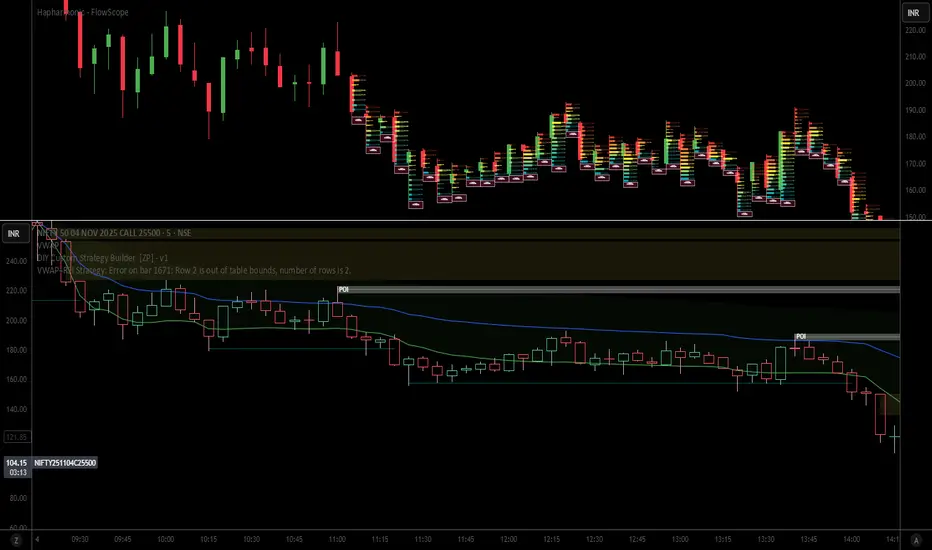
Combined VWAP Doji & RSI Volume StrategyCombine strategy of VWAP DOJI and RSI volume 60-40 crossover buy sell signal
MomentumQ Breadth 2.0MomentumQ Breadth 2.0
The MomentumQ Breadth 2.0 is a user-friendly overlay tool that helps traders analyze market breadth directly on the price chart. It supports multiple indices, flexible time frames, and optional background coloring to highlight bullish, neutral, and bearish conditions.
How It Works:
Index Selection
Choose between major market indices for analysis:
S&P 500
NASDAQ
Dow Jones Industrial Average (DJIA)
Russell 2000
Time Period Customization
Select from different moving-average periods to suit your strategy:
5-Day
20-Day
50-Day
100-Day
150-Day
200-Day
Shorter periods react faster to changes in participation, while longer periods show broader market trends.
Dynamic Symbol Mapping
The indicator automatically selects the correct breadth symbol based on the chosen index and time period using TradingView’s request.security() function. No manual lookup is needed.
Symbols Used
S&P 500
5-Day: S5FD
20-Day: S5TW
50-Day: S5FI
100-Day: S5OH
150-Day: S5OF
200-Day: S5TH
NASDAQ
5-Day: NDFD
20-Day: NDTW
50-Day: NDFI
100-Day: NDOH
150-Day: NDOF
200-Day: NDTH
Dow Jones Industrial Average (DJIA)
5-Day: DIFD
20-Day: DITW
50-Day: DIFI
100-Day: DIOH
150-Day: DIOF
200-Day: DITH
Russell 2000
5-Day: R2FD
20-Day: R2TW
50-Day: R2FI
100-Day: R2OH
150-Day: R2OF
200-Day: R2TH
Key Features
Overlay mode displays the breadth line directly on the price chart.
Dynamic background coloring highlights key breadth zones:
Above 70 = Bearish/Overbought, 50–70 = Slightly Bearish, 30–50 = Slightly Bullish, Below 30 = Bullish/Oversold.
Fully customizable colors and transparency.
Automatic adjustment for dark or light chart themes.
Toggle background coloring on or off in the settings.
Concepts and Calculations
Market breadth measures how many stocks are participating in a market move. The indicator uses predefined symbols showing the percentage of index constituents trading above their chosen moving average. A rising breadth line indicates strong participation, while a falling line signals weakness or narrowing leadership.
How to Use
Add the MomentumQ Breadth 2.0 to your TradingView chart.
Open the settings panel.
Select your preferred index and time period.
Enable or disable background coloring as desired.
Interpret the breadth readings:
Above 70 = strong momentum (possible overbought), around 50 = neutral, below 30 = weak momentum (possible oversold).
Why It’s Useful
Shows market participation directly over price action.
Covers four major indices and six time frames.
Highlights sentiment transitions through color shading.
Helps identify overbought, oversold, or neutral conditions quickly.
Disclaimer
The MomentumQ Breadth 2.0 is for analytical purposes only and does not guarantee profitability. All trading involves risk, and market conditions can change quickly. Always use appropriate risk management. Past performance does not guarantee future results.
Thank You for Your Support
This is a free tool created to help traders visualize market breadth with clarity and flexibility. Feedback and suggestions are welcome to guide future updates.

2-Min Strong Engulfing PatternTwo-Candle Engulfing Indicator (5-Minute Version)
This TradingView indicator detects two-candle engulfing patterns on the 5-minute timeframe. It identifies bullish and bearish reversals by analyzing the last three candles:
Bullish Engulfing: A green candle that fully engulfs the previous two red candles, signaling potential upward momentum.
Bearish Engulfing: A red candle that fully engulfs the previous two green candles, signaling potential downward momentum.
Features:
Works on the 5-minute timeframe, even if the chart is set to a different timeframe.
Plots green triangles below bullish engulfing candles and red triangles above bearish engulfing candles for easy visualization.
Built-in alert conditions notify you immediately when a pattern occurs, allowing you to react in real-time.
Lightweight and optimized for fast detection without affecting chart performance.
Use Cases:
Spot short-term reversal opportunities.
Combine with other indicators or trading strategies to confirm trends.
Receive alerts for potential entries or exits in day trading setups.

MINE CBPR Lite ✦MINE CBPR ✦ Lite is the prototype foundation of the MINE CBPR ✦ Pro —
a streamlined, publicly available version built to introduce traders to the system’s advanced Channel Breakout and Pivot Reversal logic.
It retains the essential structural detection engine of the Pro version while simplifying its layers, allowing anyone to experience precise market reversals without complex filters or heavy computation.
Designed for clarity and accessibility, it provides actionable reversal insights across all markets — from crypto futures to indices and stocks.
As the official prototype, MINE CBPR ✦ Lite represents the first step toward the full CBPR ✦ Pro experience.
Test the Lite version, experience its structure, and take your trading further with the complete Pro edition.
When you upgrade to MINE CBPR ✦ Pro, you’ll unlock twice the number of signals, enhanced structural intelligence, and exclusive features of the full CBPR system — all with permanent lifetime access to the indicator.
Experience the complete power of CBPR ✦ Pro, built for precision, performance, and total market adaptability.

MARA + IREN / BTC Divergence Monitor (v6, fixed)This indicator tracks the relative performance of two major Bitcoin miners — MARA (Marathon Digital Holdings) and IREN (Irene Energy) against Bitcoin (BTC). It calculates smoothed ratios (Miner Price ÷ BTC Price) for each miner and automatically detects divergences and convergences between them.

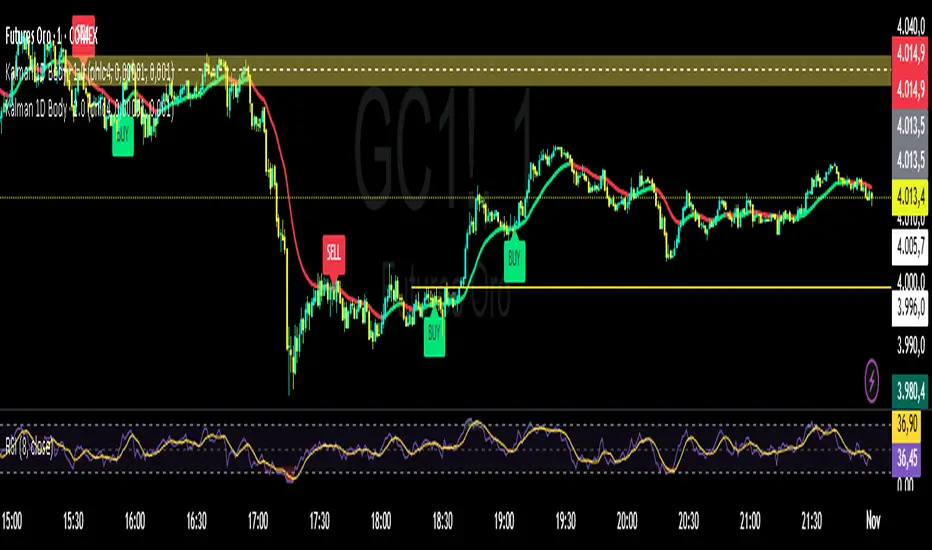
Kalman Filter by TwisterTrades(1D + Body Condition)
## 🧭 **Kalman Filter (1D + Body Condition)
This script implements a **true 1-dimensional Kalman Filter** applied to price data — not a simple moving average.
The Kalman Filter is a **Bayesian optimal estimation algorithm**, designed to separate **market noise** from the **true underlying trend** by dynamically adapting its sensitivity at every new bar.
Unlike **EMA**, **SMA**, or **VWAP**, which use fixed weighting formulas, the Kalman Filter **learns** how much to trust the current price based on how noisy and volatile the market is.
The result is a **smoother and smarter curve** that follows the real market direction while rejecting random fluctuations.
---
### ⚙️ **How It Works**
1. **Prediction:** The filter assumes the trend continues (predicts the next value).
2. **Update:** It compares the prediction with the actual price and updates its estimate based on:
* **Q (Process Noise):** how much the true trend can change.
* **R (Measurement Noise):** how noisy or unreliable the current price is.
3. The **Kalman Gain (K)** adjusts automatically — it becomes more responsive when volatility increases and more stable when the market is calm.
---
### 🎯 **Signals Logic**
The script generates **BUY** and **SELL** labels based on a combination of:
* **Trend direction:** whether the Kalman line is turning up or down.
* **Body confirmation:** the candle body closes entirely **above** or **below** the Kalman line.
**🟩 BUY signal:**
* Trend is turning bullish (line turning green).
* Candle body closes fully **above** the Kalman line.
**🟥 SELL signal:**
* Trend is turning bearish (line turning red).
* Candle body closes fully **below** the Kalman line.
You can enable alerts for both conditions:
```text
Kalman Filter: BUY signal detected (body above filter)
Kalman Filter: SELL signal detected (body below filter)
```
---
### 🔊 **Understanding Noise and Signals**
* **Noise** refers to short-term, random fluctuations in price (e.g. stop-hunts, low-volume spikes, or microstructure volatility).
* **Signal** refers to consistent, directional movement that carries information about the real trend.
The Kalman Filter works as a **signal extractor** — removing meaningless movements while keeping true directional momentum.
If the line is smooth and consistent, it means the market’s directional “signal” is clear.
If the line oscillates frequently, it means **noise dominates** — and trading signals should be taken with caution.
---
### ⏱️ **Recommended Timeframes and Parameters**
The strength of the filter depends on how noisy your timeframe is.
Here’s how to adjust it for different use cases:
| Purpose | Timeframe | Q (Process Noise) | R (Measurement Noise) | Description |
| ----------------------------- | --------- | ----------------- | --------------------- | --------------------------------------- |
| **Scalping / Microstructure** | 1m – 3m | 0.001 | 0.05 | Reacts faster, filters tick-level noise |
| **Intraday Bias / Trend** | 5m – 15m | 0.0001 | 0.01 | Balanced reactivity and smoothness |
| **Swing / Macro Bias** | 1H – 4H | 0.00001 | 0.001 | Very stable, great for clean trend bias |
💡 **Pro tip:**
* If the filter lags too much → increase **Q** slightly.
* If it reacts too much (too noisy) → increase **R** slightly.
* Always backtest adjustments visually for your market’s volatility (e.g. XAU/USD or NAS100).
---
### 📈 **Comparison with Other Indicators**
| Indicator | Adaptivity | Noise Filtering | Reactivity | Ideal Use |
| -------------------- | ---------------- | --------------- | ------------- | ---------------------------- |
| **SMA** | ❌ Fixed weights | ❌ Poor | ⚠️ Slow | Clean long trends |
| **EMA** | ⚠️ Semi-adaptive | ⚠️ Medium | ✅ Fast | Intraday direction |
| **VWAP** | ⚠️ Volume-based | ⚠️ Moderate | ✅ Good | Session-level bias |
| **Kalman Filter 1D** | ✅ Fully adaptive | ✅ Excellent | ✅ Intelligent | Any noisy or volatile market |
---
### 📊 **Usage Tips**
* Use the Kalman Filter as a **directional bias tool**, not a signal generator alone.
* Combine it with **price action**, **volume**, or **market structure** to confirm entries.
* Works exceptionally well on assets with **high noise and volatility** (e.g. XAU/USD, NASDAQ, BTCUSD).
* You can use the Kalman line instead of EMA50 or EMA100 — it provides a cleaner trend estimate without lagging as much in choppy conditions.
---
### ⚠️ **Disclaimer**
The Kalman Filter is not a predictive tool but a **state estimator** — it helps reveal the *true underlying direction* by filtering out noise.
It should be used together with sound risk management and a clear trading plan.
EDGAR EBS Institutional Hybrid V12 — box sidewayEDGAR EBS Institutional Hybrid V12 — Box sideway
🔥 Features
✅ Hybrid multi-timeframe alignment (Daily → 1M)
✅ ATR volatility filter for range detection
✅ Scalp mode for short-term reversal opportunities
✅ Final signal clarity: Strong / Mid / Mixed
✅ Compact visual dashboard optimized for traders
✅ Clean, fitted design for high-speed execution
🔒 Invite-Only Script – access granted only to authorized users.


Liquidity Trendline With Signals [StratifyTrade]Gift for my birthday let enjoy with premium indicators

Orb DivergenceOrb Divergence is a market reversal indicator that visually highlights moments when price momentum is ready to shift direction.
It detects hidden energy imbalances within price movements and identifies potential trend turning points formed by these accumulations.
The indicator displays colored orbs and clear “UP / DOWN” signals to mark upcoming reversals in a simple and intuitive way.
Rather than focusing on short-term reactions, it emphasizes key zones where market momentum may truly change.
Designed as a visual compass, Orb Divergence helps you spot the moments when the market takes a breath — and prepares to turn.
For a deeper and more data-driven approach to market structure and reversal dynamics, you may also want to explore Teometric Demand Model V3;
