Arcblock (ABT)** requested analysis **
On the above 2-day chart price action has corrected 50% since the sell signal in late January. Now is a good long moment. Why?
1) You know why.
2) Past resistance become support.
3) Support prints on the Fibonacci 0.786
4) Multiple oscillators print positive divergence with price action. On both USD and BTC pair.
Is it possible price action falls further? Sure.
Is it probable? No.
Ww
Type: Trade
Risk: 2%, tiny market cap
Timeframe: Now
Return: No idea
ABTUSD trade ideas

What was once resistance, now becomes support ABT is in a powerful channel that has been non-stop breaking new highs. this channel was drawn out a few weeks before this most recent upside move. If we can continue to maintain on the upperside on this channel, it would be very bullish IMO.

*Update* What was once resistance, now becomes supportThis is a quick update to my previous post mentioning ABT showing relative strength within this bullish channel. The channel shown was originally drawn a few weeks before we made this move. It is really fun to see how the once resistance level, has now become it's support while we move to the upside.
Current resistance sits at 4.74 - past history does not gurantee anything in the future, however if we keep the same bullish pennant set ups, we COULD see ABT breaking into the $5-$5.80 range sooner than later.
As always, just my humble opinion, and trust me, I am often incorrect, so please do not make any of your decisions based off my thoughts. However, I am always welcome to feedback and oppossing ideas.
Cheers.

$ABT 20% Hot Setup with Ai Targets & SignalsABT 20% Hot 🔥🛗🔥Setup >>
NYSE:ABT 20% Hot Setup with Ai Targets & Signals
Currently at CHannel Demnd ZOne

Is ABTUSD already triggering c&h w/a handle only on small TFs?ABTUSD just recently hit the full target of its linear chart’s recent bull flag breakout and in the process filled out this beautifully sculpted cup that I thought would take several daily candles to complete a handle of before continuing to move upward….to my surprise price decided to only let the handle develop on the 30minute-2hr chart before breaking above the neckline. So it is currently now most valid on the 35-45 minute chart…making it far more likely the pattern can be nullified on such a small tie frame, however as of right now it is well on the way to the full c&h breakout target…a few dives back below the neckline especially on such a small time frame are quite possible too before it musters up the strength to hit the full target. If it does hit that target it is well on the way of finally hitting my much higher target of the Log charts bullflag breakout which I will link that idea below. Keep in mind because it is the log chart its measured move target from breaking up from the flag is considerably higher than the one that was on the linear chart. *not financial advice*

ABTUSD Breaking upward from a bull pennantIt looks like it is validating the break upward, full emasured move target can lead to 180% gains from current price range. Of course always possible it corrects all the way back don to the top trendline of the pennant before reaching the full target. If so that’s simply an opportunity to enter at a zone with even bigger gains potential. It could just as easily keep pumping until it reaches the full target as well. If longer consolidation it could take 1 as many as 1-3 weeks to reach the full target also…and then of course a possibility with the least probability as it somehow does a 180 and doesnt reach the full target as all since anything’s possible…but as I said, that scenario is the one with the lowest probability at the moment. *not financial advice*

ABTUSD - Massive Upside Move, More to Come or Downside We Go? As you can see, we technically set a higher low around 2.37 with the wick of the most recent upside hourly candle. It is critical that we break 2.40 within the next 24 hours, otherwise I fear we will lose some of the bulls who are in this for a quick swing trade.
For the record, I am long for over a year now, current average is $.26 =)
I believe we can see more upside, but we should tread lightly and watch volume for confirmation of price action.

ABTUSD - critical next 24 hours ABT has had an incredible upside move, but technically we have set a higher low just now with the wick of that hourly candle.
We need to break to the upside and set a new ATH withint the next 24 hours, otherwise we will likely see some more downside.
IMHO so please take any of this with a grain of salt.
For the record, I am long since $.10-$.26 average =)

ABT/USD - One more push?Today we are looking at ArcBlock
What is ArcBlock?:
ArcBlock is a platform designed to make building decentralized applications (dApps) easier. It provides developers with tools and resources to create and deploy blockchain-based apps quickly. ArcBlock features include a protocol for connecting to different blockchains, reusable components called Blocklets for adding functionality, decentralized identity management, and a marketplace for sharing and monetizing assets. Its goal is to simplify blockchain development and adoption by providing a user-friendly platform for developers.
Exchanges where you can find ArcBlock:
Bitget, Coinbase and Gate.io
Targets are on chart and stop loss as well.
Bought in at current price.
Not financial advice, dyor.
Have a chart to share? Feel free to drop it down in the comments!
Want me to check a chart for you? Let me know in the comments as well!

Story Of A Market Maker Vs. The Pleb... Once upon a time there was a legendary coin called $ABT.
ABT was a very Advanced Blockchain Technology token that revolutionized the space with its seamless infrastructure and solutions developed...
Only wise Pleb's had insight in what was going on at $ABT. Many years had passed and nothing ever happened... until that one legendary day...

Apple Chart Emoji Pattern Emerges on $ABTNYSE:ABT is Drawing a Legendary N Pattern!!
Also Known as The Apple Chart Emoji Pattern!!
This pattern signifies a continuation of the trend.
We are on the Daily Candles!!
Up Up and Away we Go!!
Cheers!
-trad3zz

ArcBlock Waves ContinueArcBlock waves continuing. Know sure thing is doing wonders right now in determining tops and bottoms and when to go long. Looks like we just entered the Long Zone again.
SMI is helpful to know how momentum is going but Know Sure Thing is driving the show.
All Time High incoming!!!
-trad3zz

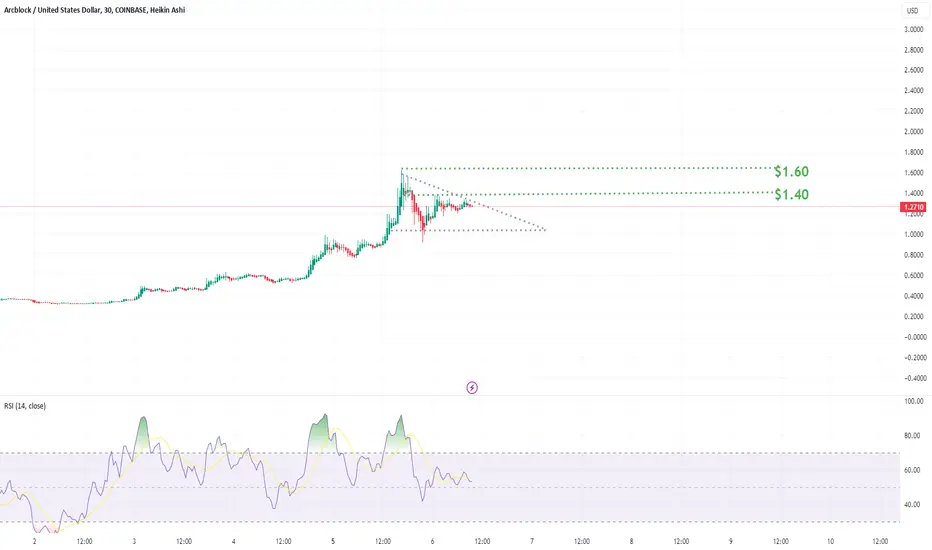
ABT to 3 DollarABT to 3 Dollar?
Current price $1.27
Target $3 to $5 dollar
Stoch Rsi = Bullish
Rsi = Neutral > Bullish
Macd = Neutral > Bullish
ABT "Golden Growth" done? Fibonacci Sequence may be at End PointABT's impressive Bull Run may be done for now.
Good news for bulls: this Golden fib was PIECED.
Exact turns (Pings), are more likely to end waves.
If it continues to run, then we can observe fibs above.
Drag DOWN on the PRICE scale to see the higher fibs.
I like to sell some coins at each fib, more at the Goldens.
==========================================

ABTUSD on watchMicro cap crypto potential AI play. Keep watch of the downtrend resistance. Three perfect touches. Based on volume, I expect that its undergoing accumulation here, and will eventually break to the upside.

ABTUSD POTENTIAL JUMPER 200% (0.55)ABT is in a flag pole formation. If it continues through the pattern it has the potential to go all the way up to .55 cents (200%) in the next day or two. Get ready. Good Trading.
