Comp spot idea.Considering the volatility ahead, as the market seems to be topped. It seems that the adding a small spot on comp would be a good idea as it still seems to be in the accumulation zone htf. Once the breakout happens it can easily touch 99.
COMPUSDT trade ideas

COMPUSDT: Bearish TrendCOMPUSDT.P is forming Rising Wedge pattern and recently, it seems that the Buyers may be getting exhausted as the pair has started to find support within the pattern. Additionally, the current price action is forming a Bearish divergence, which suggests that Sellers may be preparing for a significant downward move.
Will the Bears regain control and push the price Lower?

COMP/USDT Gearing Up for a Bull Run? 👀🚀COMP Analysis💎 Paradisers, turn your attention to #COMPUSDT, as it's currently showing promising signs of an upcoming move from a key demand level.
💎 #Compound is tracing an upward path, indicating a potential bullish breakout from its current demand level. It's anticipated to retest the demand level at $47.5 before continuing its upward trajectory. If #COMP can maintain its position above this level, it sets the stage for an ascent toward the significant supply zone at $84.
💎 Nonetheless, If #COMP encounters resistance in holding its ground above the $47.5 level, a strategic shift in our trading approach might become necessary. In that case, we would adjust our focus towards initiating a bullish movement from a slightly lower bullish OB level at $38.7.
💎 Keeping a vigilant eye on this level is critical, as a drop below could trigger a significant downward move.
💎 Stay alert and prepared, Paradisers. Your ParadiseTeam is committed to offering the latest market insights and strategic guidance to ensure you're well-prepared to handle these market developments.

COMPUSDT Elliott Waves Analysis (Investment Idea)Hello friends.
Please support my work by clicking the LIKE button👍(If you liked). Also i will appreciate for ur activity. Thank you!
Everything on the chart.
Main(investment) target zone: 850 - 1000$
Targets: 200 - 400 - 900
Cancellation of setup - consolidation under ~25
RR: 1 to ~30
risk is justified
Good luck everyone!
Follow me on TRADINGView, if you don't want to miss my next analysis or signals.
It's not financial advice.
Dont Forget, always make your own research before to trade my ideas!
Open to any questions and suggestions

COMPUSDT IDEAMajor Trenline In 3D Timeframe Chart.
Getting Ready For a Massive Bullish📈 Wave & Hope Good For Coming Weeks..🧐

📈🚀 Comp/USDT 200% Bullish Move Incoming! 📈🚀
📅 Weekly Time Frame Analysis:
The market structure of Comp/USDT has recently transformed into a bullish trend, indicating exciting opportunities ahead. In the coming days, we may witness a potentially remarkable bullish move of up to 200%! 🌟💪
🔍 Remember: Conduct Your Research!
Please note that this information is not financial advice. It is essential to conduct thorough research and analysis before making any investment decisions. ❗🔎
Trade wisely and stay informed! Good luck! 🤞💰

comp inteligentassetbullish scenario
resistances 66, 76 upper limit of the channel, 103 in 800 ema
bearish scenario
supports 53.8 in 50 ema, 50 in 200 ema, 48.3

Comp going for $200?Comp is holding the Weekly IFVG which will take comp up for
$85
$120
$175
Buy and hold


COMP UPDATE (4H TF)It seems that from where I entered "Start" we are inside an ABC, which is a diametric B wave and it is over. And now we are in wave C.
If the price reaches the supply range, we will look for sell/short positions in this range
For risk management, please don't forget stop loss and capital management
When we reach the first target, save some profit and then change the stop to entry
Comment if you have any questions
Thank You

compIt has a small resistance in the red box, which can see the above targets if it is crossed. If corrected, it should be seen how it will react to the green lines.

COMPUSDT waiting for breakdownPreviously, the head and shoulders worked perfectly, just like the textbook. Will we continue to learn the next pattern?
COMP: Resistance BreakoutTrade setup : Bullish break out from Symmetrical Triangle pattern, above 200-day moving average, signaled resumption in Uptrend. Bullish break above $60 signals continuation of uptrend, with upside potential to $80 near-term. Stop Loss (SL) at $54. Watch our recent Trading Video explaining a recent trade setup, including Take Profit and Stop Loss levels, and calculating a Risk-Reward Ratio.
Trend : Uptrend across all time horizons (Short- Medium- and Long-Term).
Momentum is Bullish but inflecting. MACD Line is above MACD Signal Line and RSI is above 55 but momentum may have peaked since MACD Histogram bars are declining, which suggests that momentum is weakening.
Support and Resistance : Nearest Support Zone is $47 (previous resistance), then $36. The nearest Resistance Zone is $60, then $80.

comp usdtBy examining and analyzing this chart, we notice the failure of the structure in the style of order accumulation, that pending orders are set at the bottom and middle of this accumulation, and we enter step purchases at the specified prices with a specified target in the picture.

COMP USDT LONG SWING | COMPUSDT | LONG @ 58 - 60 | TP @ 60.5, 61, 61.5, 62, 62.5 | SL @ 54 | PATTERN = DESCENDING TRIANGLE BREAKOUT | BINANCE |
Swing trade idea. Kindly follow targets and stop loss. Will update with new targets once all 5 are achieved. Mostly trading with PNF charts, MACD, RSI, Stoch, BPI, Cipher, MA/EMA, Support/Resistance on hourly timeframes and higher time frames
BINANCE:COMPUSDT BINANCE:COMPUSDT.P COINBASE:COMPUSD GEMINI:COMPUSD BYBIT:COMPUSDT.P KUCOIN:COMPUSDT MEXC:COMPUSDT COINEX:COMPUSDT

🚨 Trade Alert: COMP/USDT (3-5x)🚨 New Trade Alert 🚨
✅ COMP/USDT (3-5x)
📈 LONG Entry Zone: 56 - 62.22
⛔️ SL: 53
🔒 Breakeven Move: When it moves close to TP2
🎯 Take Profit:
Short Term: 62.9 - 63.7 - 64.9 - 66 - 68
Mid Term: 72 - 76 - 80 - 90 - 103
📝 Ensure you set entry orders to balance the trade's entry and aim to secure 30% of profits within the first two targets. Once profits are gained, adjust the stop orders to match the entry points or break-even levels.
⚠️ Disclaimer: Historical earnings cannot assure future outcomes. Is there a potential for risk? Certainly. The entire financial market is susceptible to uncertainties; any underlying factor or abrupt shift in market sentiment could overturn the current market trends and lead to losses. Refrain from undertaking undue risks that might jeopardize your financial stability. You are under no obligation to engage in this trade; kindly avoid the trade if you disagree with the trade analysis.
GIS TRADING®

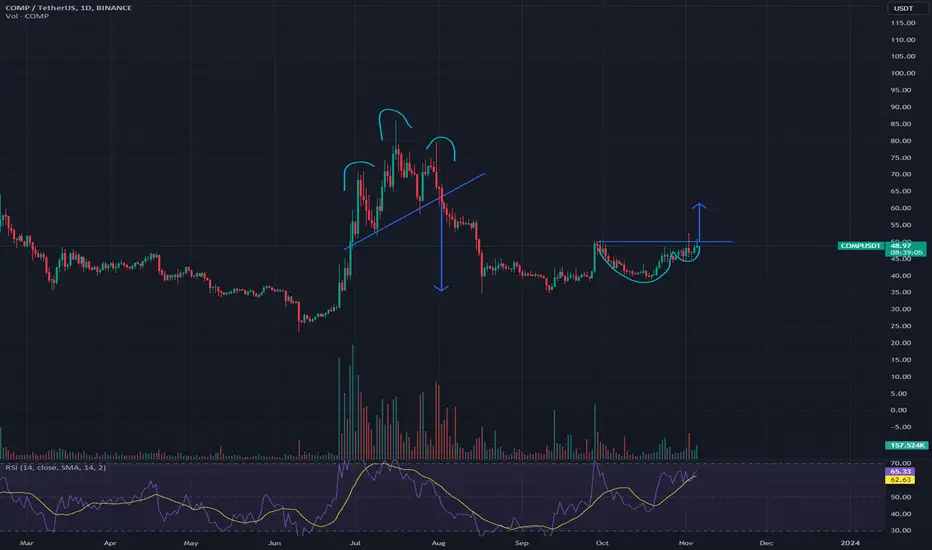
COMPUSDT - Recovery IdeaImportant resistance zones are along the green lines
I have plotted a nice bowl structure that encompasses the bear move and the following bull move that is to come.
A clear double bottom along the bottom green line.

COMPUSDT Elliot Wave Completion and Anticipated 50% UpsurgeOn a daily timeframe, COMPUSDT has exhibited a discernible higher high and higher low pattern, signaling a notable trend structure. Following the completion of wave 3, quite an evident ABC corrective move unfolded, halting precisely at the double Fibonacci support level near $47. This critical support area has proven effective in arresting the downward movement.
As long as this pivotal support remains intact, our analysis anticipates a relatively swift upside movement of approximately 50%. This projected move would complete the 5-wave upward sequence, potentially marking the culmination of this bullish phase before a potential stronger downside pullback.

COMP LOOKS BULLISH (1D)By examining the COMP chart, we can see that this symbol has completed a major double correction. What appears to be the second part of this double correction is a large triangle that is coming to an end By maintaining the green area, it can continue to climb. I have specified 2 targets for this symbol.

COMPUSDT Elliott Waves AnalysisHello friends.
Please support my work by clicking the LIKE button👍(If you liked). Also i will appreciate for ur activity. Thank you!
Everything on the chart.
Entry: Market and lower
Targets: 60 - 63 - 66
after first target reached move ur stop to breakeven
Stop: ~45 (depending of ur risk). ALWAYS follow ur RM .
RR: 1 to 3
risk is justified
Good luck everyone!
Follow me on TRADINGView, if you don't want to miss my next analysis or signals.
It's not financial advice.
Dont Forget, always make your own research before to trade my ideas!
Open to any questions and suggestions

COMPUSDT IDEAHey traders hope you are enjoying our analysis. Now we are here again with a new trading opportunity. We will discuss today about COMp
COMP Descending triangle Breakout Has Already done Expecting +300% profit In Coming Weeks

Compound resistance levelscompound has reversed and uptrending, resistance levels are as labeled. will see how things go as market can change at anytime, but as for now the chart looks bullish and is in uptrend.
DYOR, not financial advice.

Comp going to jump soon!BINANCE:COMPUSDT price is boren a major resistance. if we can hold this level soon it will go 70+ area . Also btcdom is going lower. Bullish for all alts in general.
