check the trend It is expected that a trend change will be formed in the current support range and the beginning of the corrective trend will be formed up to the specified resistance range.
Consolidation below the support area will create a continuation of the downtrend
EURGBP trade ideas

BUY EURGBP FOR TREND REVERSAL BUY EURGBP FOR TREND REVERSAL
update
STOP LOSS : 0.8487
From the movement is showing a possible trend reversal because more of the traders trading with the trend are already existing there trade positions , and on the 4hour time frame there is already signal of regular divergence which indicates a possible trend reversal too...
there is a bigger chance of a possible reversal from this level...... you are free to contact me directly here and i will respond to all questions
TAKE PROFIT : take profit will be when the trend comes to an end, feel from to send me a direct DM if you have any question about take profit or anything
Remember to risk only what you are comfortable with…….trading with the trend, patient and good risk management is the key to success here

possibility of changing the trend The price is expected to follow the indicated path and advance to the indicated support levels after making a new bottom. Then there will be a possibility of changing the trend.
If the price crosses the green resistance range, the upward trend up to the resistance range will be possible

EUR/GBP " Ascending Channel" 4H time frame "A+"TradeAfter heavy break I waited for pullback to form my trade then one damn click putting me in winning position. I trade a Price Action base on Candlestick Patterns. What trader you are be specific...?
There is time now to secure yr Trade This is potentially " A+ TRADE" as high quality trade

EUR/GBP there, two different bearish formations were present. There was a bear flag as taken from a bullish channel that arrived after a test of the .8500 handle; and bigger picture, there was a descending triangle present with that .8500 level helping to set horizontal support.
The other side of the matter, however, was a relative dearth of volatility so far in 2024 trade as the pair had spent much of the year within an approximate 120 pip range. But, given the fundamental backdrop where the ECB seems closer to cuts than the BoE, there’s an argument for continued divergence between the two economies.
At this point the .8500 handle has come back into play and there’s potential for the descending triangle to fill-in.

EURGBP LONG SETUP!It is crucial to note that FX:EURGBP is currently at a robust support level and forming a bullish divergence on the 4-hour time frame. A pullback is expected from this point, as liquidity has recently surged from the lows. Therefore, it is advisable to enter a long trade with a stop loss at the recent low and take profit at the recent high, targeting a 1:2 risk-reward ratio.

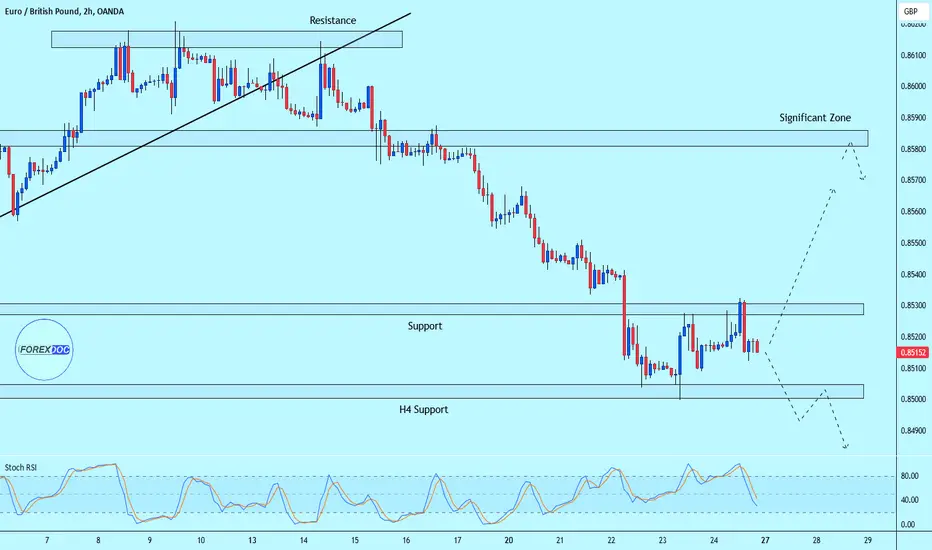
Very Strong Downtrend 🔴EUR/GBP H2
We can see very strong downtrend here. Price reacted to 0.85000 H4 support zone, but retested 0.85300 zone. It is possible to see bearish continuation, but if price breaks 0.85300 zone, I will look to buy.
EURGBP: Long Trade with Entry/SL/TP
EURGBP
- Classic bullish formation
- Our team expects growth
SUGGESTED TRADE:
Swing Trade
Buy EURGBP
Entry Level - 0.8498
Sl - 0.8475
Tp - 0.8543
Our Risk - 1%
Start protection of your profits from lower levels
❤️ Please, support our work with like & comment! ❤️

EUR GBP - LONGEUR GBP currently in a bearish trend,
but divergence has been printed
there's a possibility of reversal from this zone
long entry is recommended after the breakout of 0.85211

Daily Support Breach Opens the Door for Sellers on EUR/GBPOnce again, Europe’s shared currency (EUR) is on the back foot against the British pound (GBP), down -0.2% (WTD) and navigating waters south of weekly support from £0.8511.
Vulnerable Support on the Weekly Chart
What’s also interesting from a technical standpoint is that the cross-currency pair is now seen testing the lower boundary of a descending triangle pattern on the weekly scale, extended from the low of £0.8499. Any break of this base could have the unit take aim at support from £0.8455. Supporting further underperformance in the currency pair is price action on the daily chart recently venturing below ascending support, drawn from the low of £0.8493, with support on this chart calling for attention at £0.8474, a 1.272% Fibonacci projection ratio. Also noteworthy is the Relative Strength Index (RSI) fast approaching oversold territory.
H1 Prime Resistance to be Challenged?
In view of the daily chart demonstrating scope to discover lower levels – action informing traders that weekly price may step below the lower boundary of the ascending triangle – this opens the door for a short-term sell-on-rally scenario on the H1 chart. Assuming price remains north of H1 Quasimodo support coming in at £0.8497, this may prompt a reaction from prime resistance at £0.8511-£0.8506, which could lead to fresh lows forming beneath Monday’s trough at £0.8489.

EUR/GBP at Crucial Juncture: Multi-Timeframe Trading Insights
EUR/GBP is retesting a long-term support zone which is relevant across multiple timeframes. Let’s explore the trading opportunities available on different timeframes.
The Bigger Picture: EUR/GBP Weekly Candle Chart Analysis
EUR/GBP’s weekly candle chart shows a series of lower swing highs into a key area of horizontal support, forming a descending triangle pattern. This higher timeframe context suggests that if the support is broken, there could be downside continuation towards the 2022 lows.
Past performance is not a reliable indicator of future results
Detailed Look at the Reversal Zone: EUR/GBP Daily Candle Chart Analysis
EUR/GBP’s daily candle chart highlights the significance of the support zone currently being tested. Over the past year, this support zone has been retested multiple times, helping to define its parameters as the range between the lowest close and the lowest low.
Having formed a higher swing low in May, recent price action has seen EUR/GBP decline towards the support zone again, alerting short-term reversal traders.
Past performance is not a reliable indicator of future results
Short-term Response to Reversal Zone: EUR/GBP Daily Candle Chart Analysis
The hourly candle chart reveals that the market is already reacting to the support zone. Last week, multiple bounces from the top of the support zone were followed by a deeper test during today’s early trading, forming a bullish hammer candle and moving higher above the 9-period exponential moving average (EMA).
Past performance is not a reliable indicator of future results
Disclaimer: This is for information and learning purposes only. The information provided does not constitute investment advice nor take into account the individual financial circumstances or objectives of any investor. Any information that may be provided relating to past performance is not a reliable indicator of future results or performance. Social media channels are not relevant for UK residents.
Spread bets and CFDs are complex instruments and come with a high risk of losing money rapidly due to leverage. 80.84% of retail investor accounts lose money when trading spread bets and CFDs with this provider. You should consider whether you understand how spread bets and CFDs work and whether you can afford to take the high risk of losing your money.

Eur Gbp long EUR/GBP Long Signal: Bullish Outlook
Analysis:
The EUR/GBP pair is showing a promising long signal, driven by a combination of technical patterns and fundamental factors suggesting upward momentum. Here’s a brief overview of the bullish outlook:
Technical Indicators:
Support Zone: EUR/GBP has found strong support around the 0.84700---0.84430 level, This support zone provides a solid foundation for potential upward movement.
Eurozone Economic Recovery: The Eurozone is showing signs of economic recovery, supported by robust manufacturing and services sector data. This positive economic backdrop strengthens the Euro against the British Pound.
The European Central Bank (ECB) is maintaining a relatively more supportive monetary policy stance compared to the Bank of England (BoE), which is grappling with inflationary pressures. This divergence in policy outlooks is likely to favor the Euro over the Pound.
The EUR/GBP pair presents a compelling long opportunity, supported by strong technical indicators and favorable fundamental factors. Traders should stay vigilant and adjust their positions as needed, keeping an eye on key economic data releases and geopolitical developments that could impact market dynamics.

EURGBPEURGBP has been on a downward trend for some days, I expect the downward movement to continue, from currently position, I am expecting EURGBP to move downward and make a new lower low.

EUR/GBPA bullish flag is a technical analysis pattern that indicates a potential continuation of an existing upward trend. It resembles a flag on a pole and is used by traders to identify short-term consolidation periods followed by a breakout in the direction of the prevailing trend. Here's an overview of the bullish flag pattern:
Structure of a Bullish Flag
1. **Flagpole**: This is the initial sharp upward movement in price, representing a strong bullish trend.
2. **Flag**: After the sharp rise, the price consolidates, moving in a small, downward-sloping or horizontal channel. This consolidation forms the flag part of the pattern.
3. **Breakout**: After the consolidation phase, the price breaks out of the flag pattern, continuing the upward trend.
Identifying a Bullish Flag
1. **Strong Uptrend**: Look for a strong upward movement (flagpole) in the price of the asset.
2. **Consolidation**: Identify a consolidation phase where the price moves sideways or slightly downward in a parallel channel (flag).
3. **Volume**: During the flag formation, the volume typically decreases, indicating a lack of strong selling pressure.
4. **Breakout**: A breakout from the flag pattern occurs with an increase in volume, resuming the upward trend.
Example
1. **Flagpole**: The price of a stock rises from $50 to $70 rapidly.
2. **Flag**: The price consolidates between $65 and $70, forming a downward-sloping channel.
3. **Breakout**: The price breaks out above $70 with increased volume, continuing the uptrend.
Trading the Bullish Flag
1. **Entry Point**: Enter the trade when the price breaks above the upper trendline of the flag with increased volume.
2. **Stop-Loss**: Place a stop-loss order below the lowest point of the flag to manage risk.
3. **Target Price**: The target price is usually estimated by adding the length of the flagpole to the breakout point.
Example Calculation
- **Flagpole Length**: $70 - $50 = $20.
- **Breakout Point**: $70.
- **Target Price**: $70 + $20 = $90.
Benefits and Risks
**Benefits**:
- **Clear Pattern**: The bullish flag is relatively easy to identify and trade.
- **Continuation Signal**: It signals the continuation of an existing uptrend, providing traders with a clear direction.
**Risks**:
- **False Breakouts**: There is a risk of false breakouts, where the price breaks out of the flag but then reverses.
- **Market Conditions**: The pattern is more reliable in strong trending markets and less effective in choppy or sideways markets.
Conclusion
The bullish flag pattern is a powerful tool for traders looking to capitalize on the continuation of an uptrend. By identifying the initial strong move, the consolidation phase, and the breakout, traders can set up trades with clear entry and exit points, effectively managing risk and potential rewards.

EURGBP LONG TERM Buying TRADING IDEAHello Traders
In This Chart EURGBP HOURLY Forex Forecast By FOREX PLANET
today EURGBP analysis 👆
🟢This Chart includes_ (EURGBP market update)
🟢What is The Next Opportunity on EURGBP Market
🟢how to Enter to the Valid Entry With Assurance Profit
This CHART is For Trader's that Want to Improve Their Technical Analysis Skills and Their Trading By Understanding How To Analyze The Market Using Multiple Timeframes and Understanding The Bigger Picture on the Chart

[EURGBP] RED FLAG Down Trend [Date 27-31/5/24]Date 27-31/5/24
Mouth Weekly Daily Position
Bias Short
Strong Supply Short
Target 0.76262
Weekly Daily Bias Short
1st Target 0.83262
H4 Follow Trend
0.85460 Zone
Now
Miss a Train

EUR GBP IN A RANGE ZONEEURGBP is trading in a range for quite a while, currently taken a support from a key support area good buying opportunity with a short stop loss

EURGBP Harmonic Pattern Long Trade EURGBP Bullish IdeaEURGBP Harmonic Pattern Long Trade EURGBP Bullish Idea
Instant Entry or at Breakout of B point
and new Higher High.

EURGBP FORREXThe Chart was printing a bearish Trend but their was divergence so after the divergence the trend become bullish as it already made HH and HL.
The Entry will be instant 0.85183 and the stop loss will be 0.85030

EURGBP: Wait for Confirmation Before Bullish EntryThe EURGBP is testing a critical support level at 0.85 on the daily chart. While a bullish rally seems likely, cautious entry is advised to avoid potential retracements aimed at trapping retail traders.
Key Points:
1. Price dipped close to the 0.85 support zone.
2. Upward move possible, but confirmation is crucial.
3. Wait for a daily candle close above 0.8530 before entering a long position.
4. This will provide a stronger signal of a bullish breakout.
Remember: The market can be unpredictable. Always practice proper risk management and consider using stop-loss orders.

EURGBPhello everyone, this is based on day tf, the price has reached strong support area, the price may get bullish and may breakout of 200ma.. currently the price did recover last Thursday after PMI news, while GBP dip with poor retail news.. some minor news for euro this week.. may recover more.. price dropped from 0.8532 to 0.8515 based on 15min tf ... price need to make new high above 0.8532 to show Euro in strength... 0.8532 is all time strong resistance area that need to break for price to remain bullish...

Swing Sniper Signals Long for $EURGBPLong signal printed. Coming off bottom of bearish channel. Should be long @ market open up to 0.8590 (near top of channel and major supply zone).

