EURUSD trade ideas

SELL EURUSDEURUSD is in a bearish and descending channel on the daily and weekly timeframes.
Next major drop will occur with a break and close below area 1.05 and with a target to the lower channel and the supply support zone at area 0.85.

EU idea for longBest for long term
Conditions: Do not break the Fibo line 38.2%.
And if the conditions are violated The price may go down to Fibo 61.8% or at price 1.02036.

eurusd shport at short termeurusd is my bet to short at short term conditions, until 1.07733usd/eur
trend and price actions looking for that bet,

EURUSD: Intraday:Upon examining the updated chart for EUR/USD, it appears our previous analysis was profitable. Let's break down the current chart and provide an updated intraday analysis based on the new information provided.
Previous Day Analysis Review
In our previous analysis, we noted key support and resistance levels, the short-term upward channel, and the highlighted support zone. The suggested bullish scenario played out, as the price respected the lower boundary of the channel and moved upward, yielding profitable trades for those who followed the strategy.
The price is still moving within the upward channel marked in red.
The lower boundary of the channel remains around 1.08600, with the upper boundary near 1.08900.
Support and Resistance:
The highlighted support zone (purple) around 1.08550 - 1.08650 remains critical.
Near the lower boundary of the channel at 1.08600.
The upper boundary of the channel at 1.08900.
The price recently tested the upper boundary and pulled back, suggesting a potential retest of the support zone and the lower boundary of the channel.
A rebound from the support zone would align with the short-term bullish trend within the channel.
Trading Scenarios
Entry Point: Near the support zone at 1.08550 - 1.08650.
Target: The upper boundary of the channel that could around 1.08900 or more.
Stop-Loss: Below 1.08500, just under the support zone.
The intraday analysis confirms a profitable outcome from our previous analysis. The key levels to monitor include the support zone around 1.08550 - 1.08650 and the upper boundary of the channel at 1.08900. Maintaining a disciplined approach with proper risk management is crucial for successful trading.

EURUSD INSTANT SELLManage SL during news time, intraday trade tp and sl mentioned not a financial advice

✅EURUSD has rebounded❤️EURUSD has rebounded off the crucial psychological support level at 1.08516, and it appears to be forming a. bullish flag pattern. A breakout of this pattern could lead to a further upward momentum.❤️❤️❤️

EUR/USD brainstorming early in the week market set-upAlthough this is only showing the Daily chart, I am overall looking to see EUR/USD (EU) go long. I would first like to see EU to make an attempt to go higher first in the beginning of the week to trap early long traders. Then I would like to see it Short those traders going long, which would in turn take out buyers stop losses. After early buyers have been taken out, I would like to see the market entice sellers. Once sellers are in the market, I would like to see EU bullish for the rest of the summer overall.
However, we all should know to follow what the market is doing. We can expect the market to do something based off of our strategies and what we see, but we should never be one-minded when it comes to our analysis. Although I have wrote my sentiment about the market, and I expect it to do such. I am also waiting to see if it comes to fruition. If it does not, I will look for EU to sell vs looking for it to buy for the summer.
Although we can play both sides of the market, in terms of buying and selling. The market, I believe has its long-term plan for its certain seasons, months, weeks, and days.

Bullish bias on EURUSD monthly timeframePosition: Long
Entry date: 05/25/2024 on daily timefrime.
Risk/reward: 1:2.37
Pros:
1) The quarterly trend is bullish.
2) The monthly timeframe shows a 2-2 Bullish Reversal pattern.
3) The weekly timeframe shows a potential 2-1-2 Bullish Reversal pattern that could trigger an entry on the monthly timeframe.
4) The daily timeframe shows a potential 2-1-2 Bullish Reversal pattern that could trigger an entry on the weekly timeframe.
Cons:
1) The weekly timeframe does not have continuity with the daily timeframe, but since it is an anticipatory entry, it is acceptable.
2) In a week, the monthly timeframe changes, potentially triggering entries but not reaching the TP and then reversing direction at the flip.

support n resistancelooking bullish on all timeframes. Already broke through key levels and now looking for new level to find some chill time.

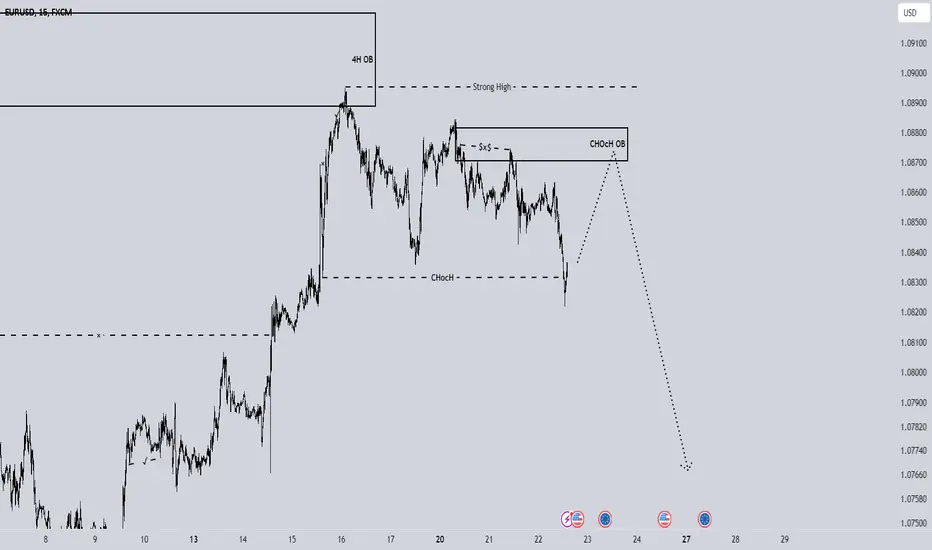
EURUSD STRUCTUREHi guys its DR Trade again, your best market structure coach, like In said im not here to tell you that your trading strategy is wrong and you should use my own , im here to show you the direction of the market for you to align it with your trading style, we will be following this for the weak to come, we are in a bearish market for this pair so till we get our blocks and confirmations we will sit on our hands and wait, do well to like share and follow, stay tuned for more updates.
EURUSD - Long @ 1.08249 Looking to hold for the next 2-3hr. 4hr shows RSI on the upswing, MACD blue line crossing RED.
30Min to confirm.
Bought @ 1.08249

EUR/USD Long Setup: Strategic Entry at 1.08288 EUR/USD Buy Trade Analysis
We are planning to enter a long position on EUR/USD at 1.08288, aligned with the 61.8% Fibonacci retracement level. The overarching trend remains bullish, indicating potential for a continued upward movement after the current corrective phase.
we may see further downside before the uptrend resumes, presenting a strategic buying opportunity at more favorable risk/reward levels.
- Key Levels:
- Entry:*1.08288 (61.8% Fibonacci retracement level)
- Stop Loss: 1.0790
- Take Profit: 1.0872 (targeting a significant resistance level)
Fibonacci Confluence:
- There is a Fibonacci confluence area around 1.0828, reinforcing this level as a strong support zone and an ideal entry point for long positions.

EURUSD: Important Key Levels For Next Week 🇪🇺🇺🇸
Here is my latest structure analysis and important key levels
to watch and trade on EURUSD next week.
Consider these structures for pullback/breakout trading.
❤️Please, support my work with like, thank you!❤️

EUR USD PRICE - BACK TO THE RESISTANCE ZONE we got a breakout from down trend line, make a small long entry to resistance zone, follow for more live updates...

EUR USD PRICE - ITS TIME TO LAND TO DOWN SIDE EUR USD price has to take support 0.5 level fib, make a small short entry to marked price line on chart, follow for more live updates...

Could EUR/USD bounce from here?Price is falling towards a support level which is a pullback support that aligns with the 38.2% Fibonacci retracement and could potentially bounce from this level to our take profit.
Entry: 1.07986
Why we like it:
There is a pullback support that lines up wit the 38.2% Fibonacci retracement.
Stop loss: 1.07688
Why we like it:
There is a pullback support level which lines up with the 50% Fibonacci retracement.
Take profit: 1.08568
Why we like it:
There is an overlap resistance level.
Please be advised that the information presented on TradingView is provided to Vantage (‘Vantage Global Limited’, ‘we’) by a third-party provider (‘Everest Fortune Group’). Please be reminded that you are solely responsible for the trading decisions on your account. There is a very high degree of risk involved in trading. Any information and/or content is intended entirely for research, educational and informational purposes only and does not constitute investment or consultation advice or investment strategy. The information is not tailored to the investment needs of any specific person and therefore does not involve a consideration of any of the investment objectives, financial situation or needs of any viewer that may receive it. Kindly also note that past performance is not a reliable indicator of future results. Actual results may differ materially from those anticipated in forward-looking or past performance statements. We assume no liability as to the accuracy or completeness of any of the information and/or content provided herein and the Company cannot be held responsible for any omission, mistake nor for any loss or damage including without limitation to any loss of profit which may arise from reliance on any information supplied by Everest Fortune Group.

Medium and long-term EURUSD buy signalHello dear traders!
Overall, as Conan mentioned in the previous analysis EURUSD is mostly showing good growth prospects in all time frames, The main pair's price increase is supported by the softer Greenback.
EU is currently trading around 1.08816, higher than 1.0875 on Monday in the early hours of trading in Asia and up 0.14% on the day as measured by Tradingview. It seems that the bullish trend has returned after the move to clear the 1.0800 resistance level. Accordingly, with the prospect of increasing prices according to the classical analysis model, I expect that after reaching the gold mark, it will overcome the resistance level to keep the price protected by sellers, but in the context of price compression and gradually approaching above. As the volume grows, sellers have less and less opportunity to hold the resistance zone. Following a breakout from the resistance level and its confirmation as support further strengthening of the pair's technical target is expected to be at least 1.1800 and 1.2400 respectively.

EURUSD TURTLE SOUP SETUP SHORT - BEFORE INTEREST RATE CUTHi. I am bearish on EURUSD now as it reached the price I was interested to open short.
Interest Rate cut for EUR is coming in June, the dollar should start reversing around now.
CFTC reported recently more commercial shorts compared to longs (attached).
Stop loss on chart.
Target 1: 1.081
Final target on retest of flip zone.

EUR-USD Bullish Bias! Buy!
Hello,Traders!
EUR-USD is trading in an
Uptrend and the pair has
Formed a bullish flag
Pattern so as the pair
Is breaking out we
Are bullish biased
And we will be expecting
A further move up
Buy!
Like, comment and subscribe to help us grow!
Check out other forecasts below too!

EUR/USD Price Forms Bullish Reversal Amid Key NewsEUR/USD Price Forms Bullish Reversal Amid Key News
Last night, the FOMC meeting minutes were released. According to USNews, there were no major surprises. However, the confirmation of persistent inflation – along with hints that some officials discussed potential future rate hikes – displayed a "hawkish" stance. The dollar index initially rose following the minutes' release but returned to pre-release levels this morning, suggesting the initial reaction might have been incorrect.
Subsequently, the Purchasing Managers' Index (PMI) data for key European economies was published. According to ForexFactory:
→ Flash Manufacturing PMI (France): actual = 46.7; expected = 45.8; previous = 45.3;
→ Flash Services PMI (France): actual = 49.4; expected = 51.8; previous = 51.3;
→ Flash Manufacturing PMI (Germany): actual = 45.4; expected = 43.4; previous = 42.5;
→ Flash Services PMI (Germany): actual = 53.9; expected = 53.5; previous = 53.2.
Overall, the actual PMI figures, considered a leading indicator of economic health, exceeded expectations and gave the euro a bullish push.
The combined effect of the euro's rise and the dollar's decline since midnight resulted in a four-hour EUR/USD chart candle with a long lower tail (indicated by an arrow), suggesting demand outweighs supply. A subsequent bullish candle could confirm this.
Technical analysis of the EUR/USD chart shows:
→ The price is within an ascending channel;
→ The 1.081 level served as resistance from 1-13 May but, following a bullish breakout on 14 May, now shows signs of support. This level is reinforced by the lower boundary of the ascending channel and the fundamental news mentioned above.
Thus, euro bulls might attempt to resume the trend and lift the EUR/USD rate to the significant resistance at 1.08750, established in April. The first test of their resolve could be the former support at 1.08466.
Trade over 50 forex markets 24 hours a day with FXOpen. Take advantage of low commissions, deep liquidity, and spreads from 0.0 pips. Open your FXOpen account now or learn more about trading forex with FXOpen.
This article represents the opinion of the Companies operating under the FXOpen brand only. It is not to be construed as an offer, solicitation, or recommendation with respect to products and services provided by the Companies operating under the FXOpen brand, nor is it to be considered financial advice.

EURUSD → A false breakout leads to a correction. 1.080?FX:EURUSD is forming a correction after a false breakdown. The movement is formed after updating the local highs. The fundamental background for the currency pair is positive.
The false breakout occurs against the resistance at 1.0885, as well as the rising line limiting the trend. If the fundamental background persists, in this case the correction will not last long and the global bullish movement may start to recover. On H1 it is worth paying attention to the support: 1,080 (liquidity area), which the price may test. This boundary may become the lower zone of the new range, which may confirm the change of trend.
Support levels: 1.080, 1.0766, 1.0736
Resistance levels: 1.0884, 1.0942
Technically, a false breakdown of resistance and corrective downward movement is forming. Today there is no strong news and movements can be calm.
Regards, R. Linda!

EURUSD simple analysis: resistance zoneA minor Elliot Wave finishes. Waiting for bearish E.W. to form.
Awaiting retest on boxes.
USD will weak it's power so USDCAD will probably show strong bullish movement.
