A clear buy for me for long runAfter Nas100 showed increadible bull, i have taken long on DE30, ofcourse with risk management in place
DE30EUR trade ideas

Bearish drop?DAX (DE40) is reacting off the pivot which acts as an overlap resistance and could potentially drop to the pullback support level.
Pivot: 18,396.65
1st Support: 18,225
1st Resistance: 18,531.90
Risk Warning:
Trading Forex and CFDs carries a high level of risk to your capital and you should only trade with money you can afford to lose. Trading Forex and CFDs may not be suitable for all investors, so please ensure that you fully understand the risks involved and seek independent advice if necessary.
Disclaimer:
The above opinions given constitute general market commentary, and do not constitute the opinion or advice of IC Markets or any form of personal or investment advice.
Any opinions, news, research, analyses, prices, other information, or links to third-party sites contained on this website are provided on an "as-is" basis, are intended only to be informative, is not an advice nor a recommendation, nor research, or a record of our trading prices, or an offer of, or solicitation for a transaction in any financial instrument and thus should not be treated as such. The information provided does not involve any specific investment objectives, financial situation and needs of any specific person who may receive it. Please be aware, that past performance is not a reliable indicator of future performance and/or results. Past Performance or Forward-looking scenarios based upon the reasonable beliefs of the third-party provider are not a guarantee of future performance. Actual results may differ materially from those anticipated in forward-looking or past performance statements. IC Markets makes no representation or warranty and assumes no liability as to the accuracy or completeness of the information provided, nor any loss arising from any investment based on a recommendation, forecast or any information supplied by any third-party.

2024-06-11 - a daily price action after hour update - daxGood Evening and I hope you are well.
dax
comment: Looking at the 1h chart, its a broad bear channel with lower highs and lower lows but the lows are 66 points Friday to Monday and 84 points from Monday to Tuesday.
current market cycle: trading range
key levels: 18300 - 18600
bull case: Bulls are struggling to keep the market above the 1h 20ema but they make bears cover at lower lows. I do not have any opinion on tomorrows direction but if bulls interpret US CPI and FOMC as bullish, I can’t see dax staying down here. Bulls want to trade to the upper bear channel line before CPI and close the gap to today’s opening at 18545. R:R is on the bull side below 18400 since I don’t see bears starting to accelerate this selling unless we get a catalyst.
Invalidation is below 18250.
bear case: Bears keep on selling around 18500 and covering on new lows. Unless we get a bigger catalyst, dax won’t move much. Above 18000 everything is bullish and that’s why bears cover at new lows, they are scalping. Bears hope for some hot US CPI numbers and get the bigger second leg down to 1800 and lower.
Invalidation is above 18600.
short term: Bullish for gap close 18545 and I will be flat going into the news releases. So it has to happen early tomorrow.
medium-long term: My long term outlook stays bearish and I expect at least a -20% correction in 2024. Medium term is 17100 while I think we can touch the big bull trend line starting 2022-10 around 16700 in 2024. —unchanged
current swing trade : None
trade of the day: Bear trend from the open and we had 8 consecutive bear bars on the 15m chart.

callyesterday we bought Us100 today let's add Ger30 . then my weekly target is about to be reached i will be off for the rest of the week. and there is Fed meeting coming this week so let's stay away from Fundamentals but on ger40 i see an inverse head and shoulder

Exhausted?We've reached a new high at the end of the past week. This week the market seems to be waiting, taking breath. This may mean that at the moment there is no immediate buying interest. An upcoming profit taking may lead to a sharp drop. After such a sharp rise it is not unusual that some profit taking of short term oriented market participants will take place.

GER40 the trend is still Bullish**Monthly Chart**
Last month candle dropped lower after creating a record high around 18568.8 level. This drop was due to a large selloff around the record high. However, this month the price continued higher and created a new record high just shy of 19000 level which indicates continues of the bullish long-term directional bias.
**Weekly Chart**
Last two weeks candles closed as dojis which shows a loss of momentum around the high. It will require a large liquidity to push the price higher. Therefore, any retracement or correction will encourage buyers to continue the move.
**Daily Chart**
There are two scenarios on the daily chart, GER40 price might continue higher without retracements and bush higher before changing the trend or the price will have a deeper retracement and then bush higher and grap the liquidity that formed above the new record high. Either way, I am only interested in buying the retracement. The direction is still bullish and there is no indication yet to move lower.

DAX to find support at market price?GER40 - 24h expiry
Expect trading to remain mixed and volatile.
Price action continues to trade around significant highs.
The bullish engulfing candle on the 4 hour chart the positive for sentiment.
Support is located at 18420 and should stem dips to this area.
Dip buying offers good risk/reward.
We look to Buy at 18425 (stop at 18325) 2,5RR
Our profit targets will be 18675 and 18745
Resistance: 18540 / 18605 / 18700
Support: 18486 / 18421 / 18361
Risk Disclaimer
The trade ideas beyond this page are for informational purposes only and do not constitute investment advice or a solicitation to trade. This information is provided by Signal Centre, a third-party unaffiliated with OANDA, and is intended for general circulation only. OANDA does not guarantee the accuracy of this information and assumes no responsibilities for the information provided by the third party. The information does not take into account the specific investment objectives, financial situation, or particular needs of any particular person. You should take into account your specific investment objectives, financial situation, and particular needs before making a commitment to trade, including seeking advice from an independent financial adviser regarding the suitability of the investment, under a separate engagement, as you deem fit.
You accept that you assume all risks in independently viewing the contents and selecting a chosen strategy.
Where the research is distributed in Singapore to a person who is not an Accredited Investor, Expert Investor or an Institutional Investor, Oanda Asia Pacific Pte Ltd (“OAP“) accepts legal responsibility for the contents of the report to such persons only to the extent required by law. Singapore customers should contact OAP at 6579 8289 for matters arising from, or in connection with, the information/research distributed.

Ger30Ger30 Clean setup.If you know you Smart money concepts,then you know that this is a clean setup .


Weekly Technical Analysis 10/06/2024Start your week by identifying the key price levels and trends.
The SpreadEx Research team has analysed the most popular markets, including stocks, indices, commodities & forex.
*KEY
Trend direction is set by the slope of the VWAP
Trend phase is determined by the current price relative to the VWAP (20) level
Support & Resistance are set by the StdDev #2 Lower and Upper respectively.
Momentum is determined by the RSI level (70 as overbought and under 30 as oversold).
----------------------------------------------------------
Analysis
Germany 40 remains inside a tight sideways consolidation of its broader bullish trend, with the price decreasing to 18,435, now below the VWAP of 18,600. Support and resistance levels have adjusted to 18,379 and 18,820, respectively. The RSI has decreased to 45, indicating a further moderation in upside momentum compared to the previous report.
UK 100 remains in the consolidation phase of a bullish trend, with the price decreasing towards the June lows, and still below the VWAP of 8,284. Support has adjusted to 8,134, while resistance has increased to 8,434. The RSI has decreased to 42, reflecting a significant weakening in momentum compared to the previous report.
Wall Street has made no major upside or downside progress in the past 3 months - remaining in a neutral consolidation phase, with the price recently decreasing to 38,712, now below the VWAP of 38,925. Support and resistance levels have adjusted to 37,893 and 39,958, respectively. The RSI has slightly decreased to 45, signalling a reduction in bullish momentum compared to the previous report.
Brent Crude remains in a bearish trend and continues in an impulsive phase, with the price decreasing to 79.64 and probing the April lows and 75.00, below the VWAP of 81.27. Support has adjusted lower to 77.24, while resistance has increased to 85.30. The RSI has decreased to 41, indicating a strengthening of bearish momentum compared to the previous report.
Gold is trading sideways in a neutral consolidation since topping in mid-April, with the price recently sharply falling to 2,291, now below the previous VWAP of 2,352. Support has adjusted higher to 2,272, while resistance has decreased to 2,432. The RSI has decreased to 41 alongside a big bearish engulfing candlestick on the daily chart, indicating new bearish momentum.
EUR/USD remains broadly trendless with the price more recently decreasing to 1.0749, now below the VWAP of 1.0846 - and indicating a possible new phase of weakness. Support has adjusted lower to 1.0768, while resistance has increased to 1.0923. The RSI has decreased to 39, indicating a significant increase in bearish pressure compared to the previous report.
GBP/USD remains in a bullish trend but has transitioned into a corrective phase, with the price slightly decreasing to 1.2713, now around the VWAP of 1.2738. Support has adjusted higher to 1.2671, and resistance has decreased to 1.2805. The RSI has decreased to 51, indicating a moderation of bullish sentiment compared to the previous report.
USD/JPY remains in a bullish trend - although it has still not overcome the late April peak - and has just reentered an impulsive phase, with the price increasing slightly to 157.03, now above the previous VWAP of 156.54. Support has adjusted higher to 155.16, while resistance has increased to 157.92. The RSI has decreased to 55, reflecting a moderation of bullish momentum compared to the previous report.

#202424 - a weekly price action market recap and outlook - dax Good Evening and I hope you are well.
dax xetra - this is the first time I post a xetra chart as well. I trade the dax cfd but I want to find out how big the interest in my post is for xetra vs cfd. Only difference is in price.
Quote from last week:
bear case: Bears making lower highs and lower lows. They closed 3 consecutive days below the daily 20ema and it was the 3rd consecutive monthly close below 18500. They also printed 3 consecutive weekly bear bars. Having said all that, bears sold off for 525 points while the last pull-back from the previous ath sold off for 940 points. So what did they accomplish in the past 3 weeks? Not much. Are they really betting on a big acceleration downward now at the bull trend line, after they tried for 3 weeks now or will the face the reality, that the market does not want to go lower and will give up on shorts? Only possibility I see is that they get a big big gap down on Monday Globex or early on to stay below the breakout price of 18500ish (counting only the bar body). If bulls get above the daily ema again, I think they will give up and they would try again 18770 or possibly even wait for 18880 again. If we get a leg up and it’s strong, I can see bears just not even trying and we would find out where bulls want to take it.
comment: Market in total balance inside key levels. It’s the 4th consecutive bear week but we are still above the midpoint of the first week of May where dax gained 800 points. This selling is as weak as it gets and that’s why another leg up is much more likely than an acceleration to the downside. We are oscillating around the daily 20ema at 18550 and right at the bull trend line from January. Market is in breakout mode and will have it next week. Odds favor the bulls but I wait for confirmation after US CPI and FOMC.
current market cycle: trading range
key levels: 18400 / 18900
bull case: It’s a trading range near the ath and that’s all there is to it. If market was rejecting higher prices, we would have traded below 18000 long time ago. The bullish gap#2 stayed open and there is an argument for a head & shoulders bottom with the neckline 17700 and a measured move would bring us right back to retest 18900.
Invalidation is below 18400.
bear case: Unless bears print a big daily bear bar below 18400, they are not doing much. Thursday and Friday we made higher highs and higher lows and I do think bears will give up on Monday if the buying pressure is strong enough. Not much more magic to it currently.
Invalidation is a daily close above 18650.
outlook last week: “In favor of bulls, if they break 18650 early next week. TP 18770 at least but I think we can do a total ripper. If bears somehow manage to keep it below 18700, we can retest the lows and if they do a big surprise below 18400, we will see 18250 fast and below that is 17900.”
→ Last Sunday we traded 18497 and now we are at 18557. Bulls got a higher high but bears kept it below 18650 for the week. Not the worst outlook but not on point either.
short term: Still in favor of the bulls, unless bears get a strong daily close below 18400. Retest of 19000 is expected. If we can’t get it before CPI & FOMC and CPI comes in hot, I will go big on shorts for at least 17900 over the next 1-3 weeks.
medium-long term: 17000 over the next 3-6 Months and when we get there, I update again.
current swing trade: None and depending on Wednesday, I will initiate new positions.
Chart update: The wave thesis is gone. This sideways movement has gone on for too long and we might see 18890 again but just as a leg inside a trading range. If it strongly moves way beyond 18900, I’m wrong and we might be on our way to 19400 or 20000.

Long DAXseems like a decent technical level, and with prospects of lower interest rates, I think this could be a decent buy.

Short DAX ideaThe simple ideas are often the best! Lets see DAX pull back a few 100 points around these levels.

DAX H4 | Heading into swing-high resistanceThe DAX (GER30) is rising towards a swing-high resistance and could potentially reverse off this level to drop lower.
Sell entry is at 18,855.31 which is a swing-high resistance.
Stop loss is at 18,960.0 which is a level that sits above the 161.8% Fibonacci extension level and the all-time high.
Take profit is at 18,595.85 which is an overlap support.
High Risk Investment Warning
Trading Forex/CFDs on margin carries a high level of risk and may not be suitable for all investors. Leverage can work against you.
Stratos Markets Limited (www.fxcm.com):
CFDs are complex instruments and come with a high risk of losing money rapidly due to leverage. 68% of retail investor accounts lose money when trading CFDs with this provider. You should consider whether you understand how CFDs work and whether you can afford to take the high risk of losing your money.
Stratos Europe Ltd, previously FXCM EU Ltd (www.fxcm.com):
CFDs are complex instruments and come with a high risk of losing money rapidly due to leverage. 70% of retail investor accounts lose money when trading CFDs with this provider. You should consider whether you understand how CFDs work and whether you can afford to take the high risk of losing your money.
Stratos Trading Pty. Limited (www.fxcm.com):
Trading FX/CFDs carries significant risks. FXCM AU (AFSL 309763), please read the Financial Services Guide, Product Disclosure Statement, Target Market Determination and Terms of Business at www.fxcm.com
Stratos Global LLC (www.fxcm.com):
Losses can exceed deposits.
Please be advised that the information presented on TradingView is provided to FXCM (‘Company’, ‘we’) by a third-party provider (‘TFA Global Pte Ltd’). Please be reminded that you are solely responsible for the trading decisions on your account. There is a very high degree of risk involved in trading. Any information and/or content is intended entirely for research, educational and informational purposes only and does not constitute investment or consultation advice or investment strategy. The information is not tailored to the investment needs of any specific person and therefore does not involve a consideration of any of the investment objectives, financial situation or needs of any viewer that may receive it. Kindly also note that past performance is not a reliable indicator of future results. Actual results may differ materially from those anticipated in forward-looking or past performance statements. We assume no liability as to the accuracy or completeness of any of the information and/or content provided herein and the Company cannot be held responsible for any omission, mistake nor for any loss or damage including without limitation to any loss of profit which may arise from reliance on any information supplied by TFA Global Pte Ltd.
The speaker(s) is neither an employee, agent nor representative of FXCM and is therefore acting independently. The opinions given are their own, constitute general market commentary, and do not constitute the opinion or advice of FXCM or any form of personal or investment advice. FXCM neither endorses nor guarantees offerings of third-party speakers, nor is FXCM responsible for the content, veracity or opinions of third-party speakers, presenters or participants.

G30 we see buyers in control From a selling momentum in previous days we can except G30 to go pu to test the highest high as a change in direction is shown


DAX40The DAX index is at strong support and we expect it to rise to the specified area as a correction for the decline that occurred

Does the German stock market need a break?📊 In the four-hour time frame, due to the reduction of the upward momentum of the price movement and the breaking of the downward upward movement pattern, if the range of 18000 units is broken and the price stabilizes below it, the price may fall to the range of 17850 units🎯, and in the case of the strength of the range of 17700 units🎯🎯.
📊 Otherwise, the possibility of price increase up to 18500 units.

GER30 30mins - Triangle Breakout : an hour agoTriangle has broken through the support line at
6/19 11:00. Possible bearish price movement
forecast for the next 9 hours towards 18,080.10.
Expiry Date/Time: 6/19 20:59

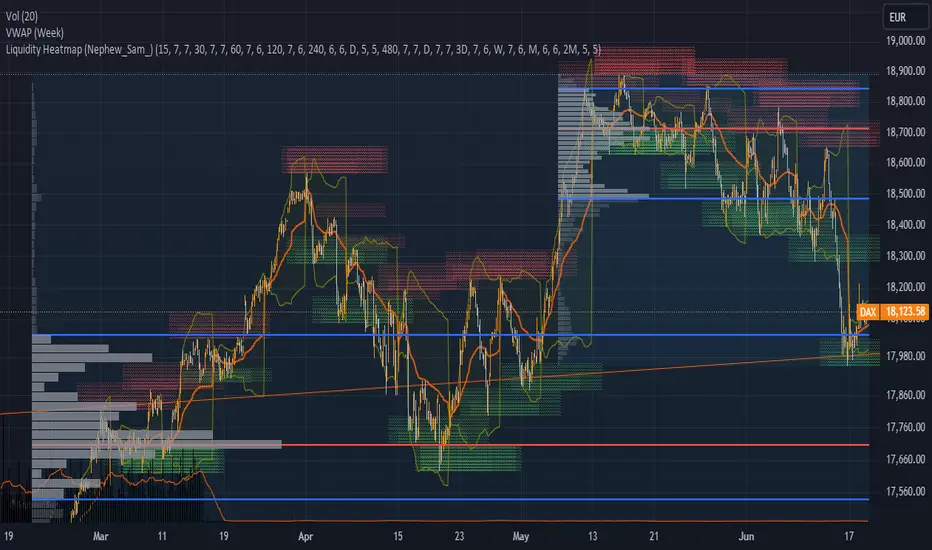
DAX ANALYSIS 19/06/2024DAX chart you provided, let's break down the key components visible in the chart:
Volume:
The volume is indicated at the bottom of the chart. The volume bars show trading activity, with higher bars representing higher trading volumes.
VWAP (Volume Weighted Average Price):
There are two VWAP lines on the chart: one for the week and one overall. The weekly VWAP is shown at 18,081.10 and the overall VWAP at 18,158.83. VWAP is used to assess the average price a security has traded at based on both volume and price.
Liquidity Heatmap:
The green and red zones on the chart represent liquidity zones. Red zones indicate areas of higher selling interest (resistance), while green zones indicate areas of higher buying interest (support).
Resistance and Support Levels:
The chart has marked key resistance and support levels with blue and red lines. Resistance is around 18,500 and support is around 17,800.
Price Action:
The current price is 18,123.58, indicating a recent downward trend followed by a consolidation phase near the support level.
Bollinger Bands:
The orange lines around the price represent Bollinger Bands, which measure market volatility and are used to identify overbought or oversold conditions. The bands are relatively tight, indicating reduced volatility.
Analysis and Commentary
Bearish Trend with Potential Reversal:
The DAX has experienced a recent bearish trend, as evidenced by the declining price action. The price is currently consolidating near a key support level around 18,000.
Resistance Levels:
The price is facing resistance around 18,500. If the price breaks above this level, it could signal a potential reversal or recovery from the recent downtrend.
Volume Insights:
The volume is crucial in confirming price movements. The recent consolidation phase near the support level has been accompanied by relatively lower volume, indicating reduced selling pressure.
Support Levels:
The key support levels are around 18,000 and 17,800. These levels could provide strong buying opportunities if the price holds above them.
Bollinger Bands:
The tight Bollinger Bands indicate reduced volatility. A significant price movement (breakout or breakdown) could be expected once the bands start to widen.
Recommendations
For Long Positions:
Consider entering long positions if the price breaks above the resistance level at 18,500 with increased volume. This could indicate a potential reversal and a bullish trend.
Setting stop-loss orders just below the current support levels (around 17,800) can help manage risk.
For Short Positions:
Short positions could be considered if the price fails to break above the resistance level and shows signs of further decline. Tight stops should be placed just above the resistance levels.
For New Positions:
Monitoring the price action near the current consolidation phase is crucial. Entering positions based on the breakout direction (either above 18,500 for longs or below 18,000 for shorts) with confirming volume can be a strategic approach.
DAX 30 Potential ShortHi Traders.
1.Ascending channel
2.Bearish Impulse out of the structure
3.LTF Correctial structure
Right now we are in a correctional structure after the bearish impulse when the correction is finish i think we can expect more bearish movement
