USDCZK Exponential Moving Average and Trend Line Foreign Currency
Trend: Up
Level: Diagonal Level, EMA 10 Level, EMA 20 Level
USDCZK trade ideas

USDCZK Triangle Chart Pattern (Target Price 22.67150)USDCZK Foreign Currency Pair
Trend: Up
Level: EMA 10, EMA 20, Diagonal, Horizontal
Signal: Break Out Candle


USDCZKMy last trade target got reached so I currently I'm updating my trade Idea from a weekly point of view (Blackline draw) are weekly support and resistance.
5 wave impulsive move completed and a triangle corrective, currently projecting a 5 wave impulsive move.

USDCZKMacro currency view and Elliot wave pattern.
What currently could be a long-term impulse move or a corrective with a 5 wave internal structure. Wave 3 is an extended not likely to pass my current target.

Bullish Bounce???Looking for a beautiful bullish bounce off the 38.2 towards the upside. Risk to reward is beautiful...originally thought this was going to sell more but after doing a top down analysis from the monthly to the 1HR TF i've confirmed for myself a great buying opportunity!
Give me your opinion!!! We all trying to get paid right???

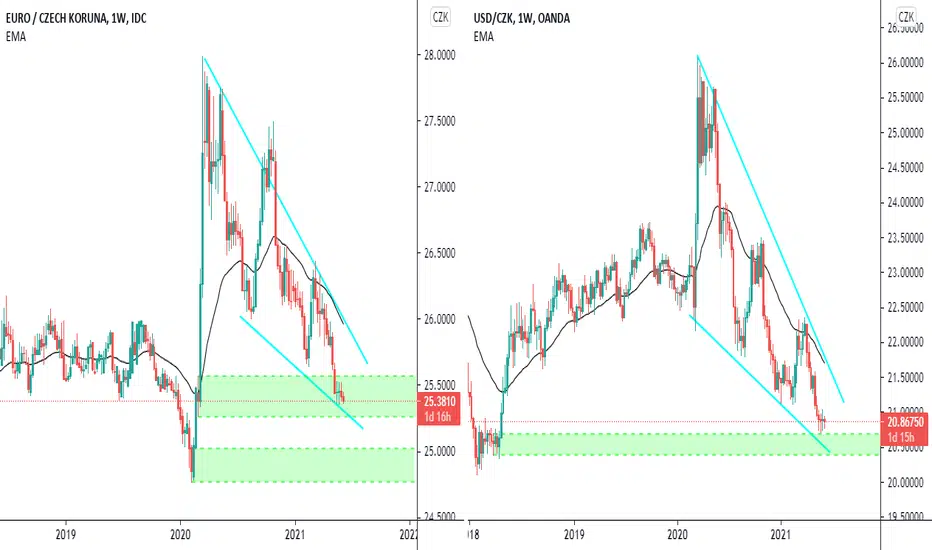
ČNB massively increases interest ratesČeská národní banka (Czech National Bank) has increased interest rates from 0.75 to 1.5 This was not expected at all and is likely to have continuous impact on the markets.
I started shorting both USD and EUR against CZK.
Support on EUR
Support on USD
There is far more room to go for Crown against Dollar, but I expect the support to be broken unless FED and ECB also increase the rates.
I will be updating my indicators this weekend with a new value.

USDCZK. Technical analysis. 26.09.2021DISCLAIMER
Trading or investing carries a high level of risk, and is not suitable for all persons. Before deciding to trade or invest you should carefully consider your investment objectives, level of experience, and ability to tolerate risk.
This content is subject to change at any time without notice, and is provided for the sole purpose of education and assistance in making independent investment decisions.
I'm only publishing a technical analysis. When making a transaction, I don't just rely on it. I do not share the indicators I use.

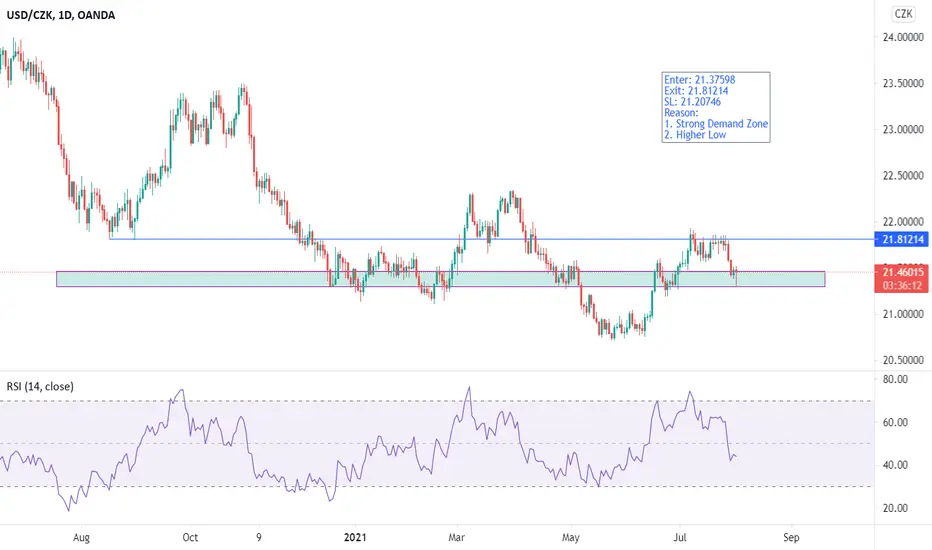
💡 USD/CZK Potential long opportunityHi traders, I'm Seeing some USD strength here. This trade could play out, so its on my watchlist 👀

Profit in money US$202.50 Profit in pips 4,361.6Enter: 21.37598
Exit: 21.81214
SL: 21.20746
Reason:
1. Strong Demand Zone
2. Higher Low
USDCZK Long Call
Bullish Reversal Signal
Candlesticks formation in place
Hammer
Inverted Hammer
Bullish Engulfing
Dow theory
Higher high and higher lows in place
Entry @ previous break point of higher high
Stop loss below lower low
2 Stage Take Profit
Entry @ 21.4905
Stop Loss @ 21.3650
TP 1 = Entry - Stop =21.6152
TP 2 = Trailing Stop loss


Česká koruna is looking good for longsBased on weekly charts, I would say long. Long-term volatility is dropping in a downside triangle...

USDCZK Entry Price Area Of The Exponential Moving AverageWatch For A Pull Back To Support Resistance Level 21.84650, Exponential Moving Average Period 10 Level 21.87884, Exponential Moving Average Period 20 21.96575

USDCZK Trend Continuation After clear price action showing us that the market is breaking higher highs along with local areas of resistance we look for the next push up that's the 2nd wave. This is an aggressive but optimal trade respecting the 3:1 ratio for risk-reward.

USD/CZK - Bullish W Pattern - analysisHello traders and community, today I will tell you shortly about situation of USD/CZK
Trend analysis
- As you can see from the USD/CZK daily chart, we are currently forming bullish W pattern (yellow line) and also short versions of W pattern, that's why most of factors shows us about possible bullish scenario in long term. Resistance level from Fibonacci Retracement Analysis stays on 23,48 price level and Support level remains on 21,28 price level. Global trend of this pair is still bullish and therefore I recommend as a trader to open positions only if you are prepared for long time scenario (as you can see from the white lane) and close position near 23,48 price level. On the other hand for short period of time I recommend to keep tracking correct and trustworthy signals for opening positions.
Chart pattern
- Bullish W pattern formation (functioning)
Technical indicators
- RSI: market is overbought right now, that's why we are returning in borders (Bearish signal)
- MACD: market is bullish cause of MA lines are still enough close to each other and overall trend is going uptrend (Bullish signal)
- BB: Volatility of the market started increasing after range movement accomplished (Bullish signal)
- MA (10,20): MA10 is above the level of MA20 and moving upward (Bull signal)
= Bullish movement prevails
Dear friends, please push the like button, write comments below, follow me for more technical analysis and share this post with other traders - that would be the best support, Thank you for your attention!
Tell us about your opinion for making better decisions in trading :)
P.S.: Information provided is only educational and should not be used to take action in the market.


USDCZK LONG TRADEThe daily chart printed a bullish inverted hammer candle at support. I am going long and targeting previous resistance.

Long opportunity for USD/CZKPrice has reached a strong support on the monthly, weekly and daily time frame.
Looking for a bounce from this point and going long, also now resting on the 0.236 Fib retracement from the highest historic point, to the lowest.

USD/CZKThere is a convergence on 1D time frame.
The fake out to the downside from the falling wedge.
The fake out has formed double bottom on 4H TF with the convergence, which is a double bullish sign.
Return to the falling wedge and bullish breakout is expected.
Also, there is a possibility of the further HnS formation on 1W TF.
This is not the financial advice.
Any feedback is welcomed.

