Could price reverse from here?USO/USD is rising towards a resistance level which is an overlap resistance that lines up with the 78.6% Fibonacci retracement and could potentially reverse from this level to our take profit.
Entry: 78.92
Why we like it:
There is an overlap resistance level which lines up with the 78.6% Fibonacci retracement.
Stop loss: 80.80
Why we like it:
There is a pullback resistance level.
Take profit: 76.59
Why we like it:
There is an overlap support level which is slightly above the 38.2% Fibonacci retracement.
Please be advised that the information presented on TradingView is provided to Vantage (‘Vantage Global Limited’, ‘we’) by a third-party provider (‘Everest Fortune Group’). Please be reminded that you are solely responsible for the trading decisions on your account. There is a very high degree of risk involved in trading. Any information and/or content is intended entirely for research, educational and informational purposes only and does not constitute investment or consultation advice or investment strategy. The information is not tailored to the investment needs of any specific person and therefore does not involve a consideration of any of the investment objectives, financial situation or needs of any viewer that may receive it. Kindly also note that past performance is not a reliable indicator of future results. Actual results may differ materially from those anticipated in forward-looking or past performance statements. We assume no liability as to the accuracy or completeness of any of the information and/or content provided herein and the Company cannot be held responsible for any omission, mistake nor for any loss or damage including without limitation to any loss of profit which may arise from reliance on any information supplied by Everest Fortune Group.
USOIL trade ideas

USOIL Sellers In Panic! BUY!
My dear friends,
Please, find my technical outlook for USOIL below:
The instrument tests an important psychological level 75.35
Bias - Bullish
Technical Indicators: Supper Trend gives a precise Bullish signal, while Pivot Point HL predicts price changes and potential reversals in the market.
Target - 75.86
About Used Indicators:
Super-trend indicator is more useful in trending markets where there are clear uptrends and downtrends in price.
———————————
WISH YOU ALL LUCK

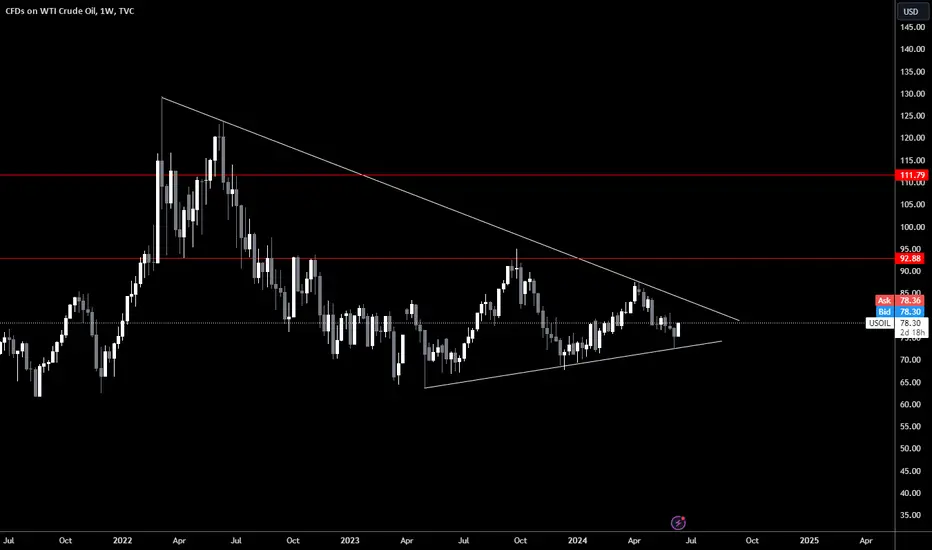
WTI in weekly chartHello
It seems that USOIL decided to make a time-consuming pattern like Triangle but you know that no one can predict internal sub-waves of a triangle so the best strategy is to wait.
There are 2 scenarios:
1. Oil is rising from here as wave 3 (Red) which does not make sense but possible.
2. Oil is making a Triangle the can be wave B of ABC of X or this triangle is our x wave (Scenario 2').
I follow scenario 2.
Time shows us.
Thanks

WTI bull runHello traders! I am currently looking at oil. I noticed a strong trend line that it bounced off from. we can see it heading to 92.00 and eventually 111.00 drop a like if you agree. follow for more ideas. thanks.
USOIL BEARS WILL DOMINATE THE MARKET|SHORT
Hello,Friends!
USOIL pair is in the downtrend because previous week’s candle is red, while the price is obviously rising on the 5H timeframe. And after the retest of the resistance line above I believe we will see a move down towards the target below at 75.09 because the pair is overbought due to its proximity to the upper BB band and a bearish correction is likely.
✅LIKE AND COMMENT MY IDEAS✅

Is oil still on the upward path?📊 According to the buying pressure created in the market, if the range of 76.2 units is broken upwards and the price stabilizes above it, the price may increase to the range of 77.3 units🎯, and in case of the strength of the range, 78.4 units🎯🎯.
📊 Otherwise, the price may fall to the range of 74.0 units.

USOIL-SELL strategy 4-hourly chartIt feels we will see lower levels again, stochastic negative, and also some type of falls bull flag pattern as well.
Strategy SELL @ 75.25-75.75 and take profit @ 72.25 for now SL around 76.90.

USOil WTI Short 4Hour divergence- Trendline1. Market Analysis:
Asset: USOil (WTI Crude Oil)
Timeframe: 4-hour
Pattern: Bearish divergence identified
Additional Confirmation: Trendline resistance
2. Entry Criteria:
Divergence Confirmation: Identify bearish divergence on the 4-hour timeframe using indicators like RSI or MACD. Bearish divergence occurs when the price forms higher highs, but the indicator forms lower highs.
Trendline Resistance: Confirm that the price is approaching or touching a significant trendline resistance, which has been respected in the past.
3. Trade Setup:
Entry Point: Place a sell order near the trendline resistance once bearish divergence is confirmed and there is a rejection from the trendline. You can enter the trade at the close of a bearish candle that forms near the trendline resistance.
Stop-Loss: Set the stop-loss order above the recent swing high or slightly above the trendline to limit potential losses if the price breaks through the resistance.
Take-Profit: Determine your take-profit target based on key support levels or a favorable risk-reward ratio. Consider using a risk-reward ratio of at least 1:2 to ensure that potential profits outweigh potential losses.
4. Risk Management:
Position Size: Calculate your position size based on your risk tolerance and the distance between your entry point and stop-loss level. Ensure that you only risk a predetermined percentage of your trading capital per trade (e.g., 1-2%).
Risk-Reward Ratio: Aim for a risk-reward ratio of at least 1:2 or higher. This means if your stop-loss is 50 pips above your entry, your take-profit should be at least 100 pips below your entry.
5. Additional Confirmation:
Volume Analysis: Check for an increase in volume to confirm the validity of the bearish divergence and the potential for a strong downward move.
Support and Resistance: Ensure that the trade aligns with key support and resistance levels on higher timeframes (e.g., daily or weekly).
6. Trade Execution:
Place Orders: Set your sell order, stop-loss, and take-profit levels according to the above criteria.
Monitor the Trade: Keep an eye on the trade to manage it effectively. Adjust the stop-loss to break even or trail it as the trade progresses in your favor if necessary.
7. Review and Adjust:
Post-Trade Analysis: After the trade is closed, review the outcome to learn from the trade. Evaluate what worked well and what could be improved for future trades.
Example Trade Setup on TradingView:

US-Oil will further push upside After Testing TrendlineHello Traders
In This Chart XTIUSD HOURLY Forex Forecast By FOREX PLANET
today XTIUSD analysis 👆
🟢This Chart includes_ (XTIUSD market update)
🟢What is The Next Opportunity on XTIUSD Market
🟢how to Enter to the Valid Entry With Assurance Profit
This CHART is For Trader's that Want to Improve Their Technical Analysis Skills and Their Trading By Understanding How To Analyze The Market Using Multiple Timeframes and Understanding The Bigger Picture on the Charts

Bearish drop?XTI/USD is reacting off the pivot which is a pullback resistance and could potentially drop to the 1st support.
Pivot: 75.84
1st Support: 72.48
1st Resistance: 77.86
Risk Warning:
Trading Forex and CFDs carries a high level of risk to your capital and you should only trade with money you can afford to lose. Trading Forex and CFDs may not be suitable for all investors, so please ensure that you fully understand the risks involved and seek independent advice if necessary.
Disclaimer:
The above opinions given constitute general market commentary, and do not constitute the opinion or advice of IC Markets or any form of personal or investment advice.
Any opinions, news, research, analyses, prices, other information, or links to third-party sites contained on this website are provided on an "as-is" basis, are intended only to be informative, is not an advice nor a recommendation, nor research, or a record of our trading prices, or an offer of, or solicitation for a transaction in any financial instrument and thus should not be treated as such. The information provided does not involve any specific investment objectives, financial situation and needs of any specific person who may receive it. Please be aware, that past performance is not a reliable indicator of future performance and/or results. Past Performance or Forward-looking scenarios based upon the reasonable beliefs of the third-party provider are not a guarantee of future performance. Actual results may differ materially from those anticipated in forward-looking or past performance statements. IC Markets makes no representation or warranty and assumes no liability as to the accuracy or completeness of the information provided, nor any loss arising from any investment based on a recommendation, forecast or any information supplied by any third-party.

USOIL: Elliott Wave AnalysisDetails: Wave 1 black (Cycle Degree) was completed at 67.68 as Impulse Wave and Wave 2 black (Cycle Degree) was completed at 87.60 as Double Zigzag. Wave 1 green (Primary Degree) was completed at 72.43 and prices have been developing and retracting to Wave 2 green (Primary Degree) as expecting target at Fibonacci Level 0.5-0.786
Invalidation Point: 72.43
Trading Opportunity: Wait for Wave 2 green (Primary Degree) complete and find a chance to entry the orders while price declines to Wave 3 green (Primary Degree)

USOILRSI indicates Bearish Divergence. Which means that at any time the market trend can change to LL and LH.

OIL: Day 3 breakout trades long in the market, NFP week!Hi everyone and welcome to my channel, please don’t forget to support all my work subscribing and liking my post, and for any question leave me a comment, I will be more than happy to help you!
“Trade setups, not movements”
1. DAY OF THE WEEK (Failed Breakout, False Break, Range Expansion)
Monday DAY 1 Opening Range
Tuesday DAY 2 Initial Balance
Wednesday DAY 3 (reset DAY 1) Mid Point Week
Thursday DAY 2
Friday DAY 3 Closing Range ✅ no daily cycle
2. SIGNAL DAY
First Red Day
First Green Day
3 Days Long Breakout ✅
3 Days Short Breakout
Inside Day
3. WEEKLY TEMPLATE
Pump&Dump
Dump&Pump ✅
Frontside
Backside ✅
4. THESIS:
Long: primary, day 3 long in the market, OIL looks like coiling for an explosive move. After NFP I will looking for a buy low dump and pump back either the HOW, or the breakout NY session of monday (see the green line)
Short: secondary, not really interested in short this market, unless a scalp third hour NY session HOD to LOD
Please note that the purpose of my analysis is to help me and you hunting the best trade setup for the day, none of my technical aspects are a way to forecast any directional market movement.
Gianni

OIL is testing a strong resistance zone. Be careful OIL is testing a strong resistance zone. Be careful of any bearish moves
From the previous analysis, OIL moved down from the megaphone pattern pointing down for a bigger bearish wave.
The price is already testing the base of the pattern indicating the possibility that it could go lower again.
This is just the beginning and should confirm the bearish movement and it is not a mus that it will move down.
You can pay attention to this area as oil may resume the bearish trend again.
You may find more details in the chart!
Thank you and Good Luck!
❤️PS: Please support with a like or comment if you find this analysis useful for your trading day❤️

crude and a monthly patternJust showing a monthly pattern followed by crude, will try to give some important levels shortly

Crude oil latest news interpretation and advice!The market is trading below a bearish trendline which took place at the beginning of April ; the mid-term trend is then bearish for the black gold.
- However, since the impact over $72.43, the LCrude has registered a sharp bullish price action, led by bull traders who managed to defend that zone as well as short-sellers who bought their short positions back.
The market has registered a rare V-bottom chart pattern, typically indicating a bullish reversal to come.
This scenario seems to be confirmed by the RSI indicator which already registered a bullish break-out, above its 50% level.
Meanwhile, both moving averages are also in a positive configuration following a bullish cross, the first one since the start of the mid-term bearish trend.
- Even if a clear signal from the market, given by a sharp bullish break-out of the mid-term bearish trendline is yet to come, this is seen as a bullish configuration for the market.
Indeed, the fact bull traders have now taken control of the market while US oil stockpiles have recently significantly decreased makes the possibility of bullish trend resurgence likely on a mid-term basis.
If the market manages to clear the $78.00 level, a new bullish potential towards $79.75, $81.50 and $84.00 would be unlocked.

CRUDE OIL SHORT FROM FALLING RESISTANCE|
✅CRUDE OIL surged again to retest the falling resistance
But it is a strong line
So I think that there is a high chance
That we will see a bearish pullback and a move down
SHORT🔥
✅Like and subscribe to never miss a new idea!✅

USOIL ANALYSIS (SHORT) (11/06/24)Pretty self explanatory and simple. Using the bias (Bearish) I simply mapped out the last area which created a significant break. Within this area - price should gear towards the demand zone below - however I do acknowledge that price had already reached demand in an earlier period and therefore if price breaks through the POI (For which there will be potential to do so - due to upper imbalance found on a bigger TF), I would seek for an entry point allowing me to ride out the buy.

USOIL - Summer demand expectations are supporting pricesReuters stated that the Fed has raised hobby prices sharply in 2022 and 2023 to minimize growing inflation. Rising borrowing fees for customers and corporations ought to gradual financial boom and decrease oil call for. Meanwhile, a robust dollar ought to hose down oil call for via way of means of making greenback-denominated commodities like oil extra costly for holders of different currencies.
Commenting at the surprising acceleration in oil costs, analysts at strength consulting company Gelber and Associates stated summer time season call for expectancies are helping costs.
Goldman Sachs analysts stated they anticipate Brent oil costs to upward thrust to $86/barrel withinside the 0.33 quarter. In their report, those analysts stated that strong summer time season transportation call for will push the oil marketplace right into a deficit of 1.three million barrels in step with day withinside the 0.33 quarter.
Oil costs rose regardless of the greenback growing to a four-week excessive following a pointy decline withinside the euro.
Last week, oil costs fell for the 0.33 consecutive week because of worries that the Organization of the Petroleum Exporting Countries and its allies` (OPEC+) plan to boost a few manufacturing cuts from October might similarly growth supply.
Investor interest is presently turning to US purchaser charge index records for May to be launched on June 12, searching out suggestions approximately whilst the Fed can also additionally begin decreasing hobby prices. The marketplace is additionally "waiting" for the consequences of the Fed's two-day coverage assembly beginning on June 12 with the expectancy that americaA Central Bank will preserve hobby prices stable.
The marketplace has tempered expectancies for a Fed charge reduce in September following jobs boom records launched ultimate week. According to records from LSEG Financial Company, buyers additionally diminished expectancies approximately the extent of Fed easing this year, with handiest one hobby charge reduce.

Oil to move down impulsivelyBeen tracking this for sometime now, and it has mostly behaved as expected for a couple of months. The count in oil is hard to follow, because it does not necessarily "behave" within EWT parameters, but the pattern persists, despite irregularities. I will consider this validation or invalidation. I do not know the fundamentals that will cause such a move, but the waves have led me to this conclusion. Please, scroll back and review the count and magnitude and comment if you have a different count.

USOIL BEARS WILL DOMINATE THE MARKET|SHORT
Hello,Friends!
USOIL pair is trading in a local downtrend which know by looking at the previous 1W candle which is red. On the 9H timeframe the pair is going up. The pair is overbought because the price is close to the upper band of the BB indicator. So we are looking to sell the pair with the upper BB line acting as resistance. The next target is 75.22 area.
✅LIKE AND COMMENT MY IDEAS✅

Nice weekly candles here on OilOverall pattern on higher time frames paints a clear bullish oil picture. Nice simple risk here with stops at the bottom of the weekly.

USOIL Is Bearish! Short!
Please, check our technical outlook for USOIL.
Time Frame: 12h
Current Trend: Bearish
Sentiment: Overbought (based on 7-period RSI)
Forecast: Bearish
The market is approaching a significant resistance area 78.44.
Due to the fact that we see a positive bearish reaction from the underlined area, I strongly believe that sellers will manage to push the price all the way down to 76.80 level.
P.S
Please, note that an oversold/overbought condition can last for a long time, and therefore being oversold/overbought doesn't mean a price rally will come soon, or at all.
Like and subscribe and comment my ideas if you enjoy them!
