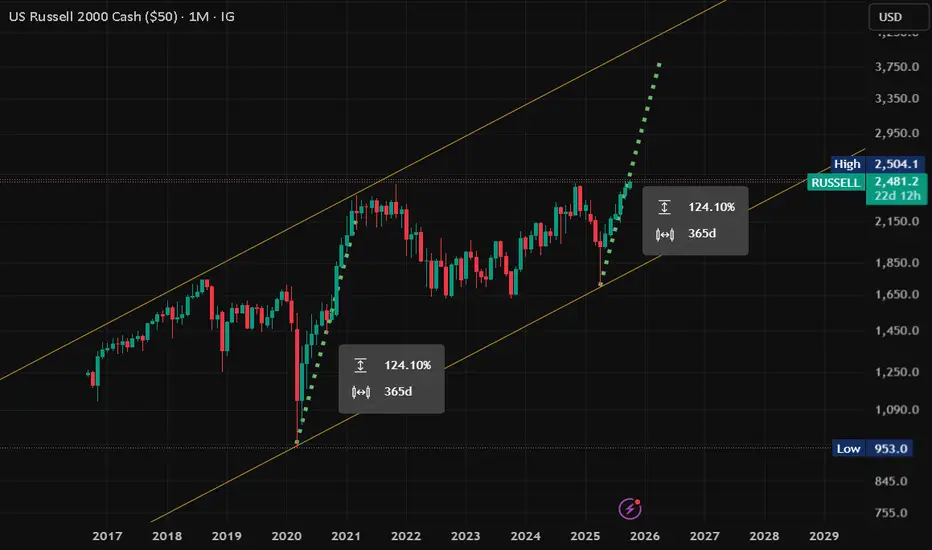
Looks like we are almost half way to the top...My drawings show what I see as a likely continuation by examining the chart and finding patterns and trendlines.
Related indices
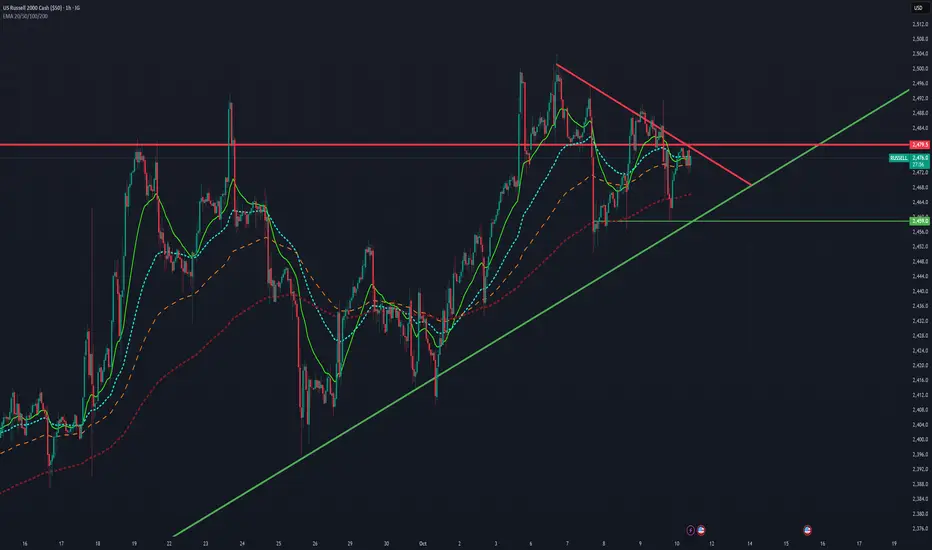
Why I Believe the Small Cap Market Might Be Bearish TodayLooking at the current 1-hour chart of the US Russell 2000 Index, several technical factors suggest that the small-cap market may be leaning toward a bearish sentiment in the short term.
First, price action has formed a descending triangle pattern, a structure that often signals potential downside
Russell hits new highsSo much for the government shutdown. US equity indices have rallied again today, thanks to ongoing bullish momentum and AI optimism. Bets that the Fed easing will continue to support corporate earnings are keeping the bulls fully in charge with traders continuing to take the ongoing US gov shutdown

Nasdaq Becoming the New Gold? The AI Boom and Market RotationSince 2020, the Nasdaq has completely pulled away from the pack. Compared to the S&P 500, Russell 2000, the dollar, and even gold, it’s been the clear leader — fueled by the AI boom and the massive flows into tech giants like NVIDIA, Microsoft, and Meta. While gold used to be the classic safe haven,

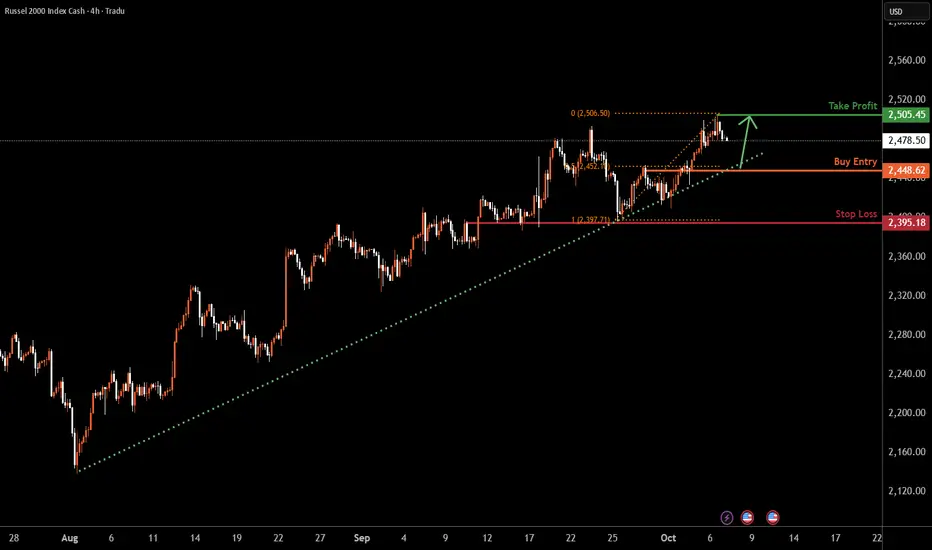
US2000 H4 | Potential Bullish Continuation AheadBased on the H4 chart analysis, we could see the price fall to the buy entry at 2,448.62, which is a pullback support that aligns with the 50% Fibonacci retracement and could bounce from his level to the take profit.
Stop loss is at 2,395.18, which is a pullback support.
Take profit is at 2,505.45
Russell eases to test key short-term supportThe Russell has bounce off its lows a tiny bit but could we now see a more decisive recovery heading deeper into the U.S. session?
The markets have been holding firm with tech sector leading the spx500 to a new high today, even though the index then came off earlier highs amid profit taking with go
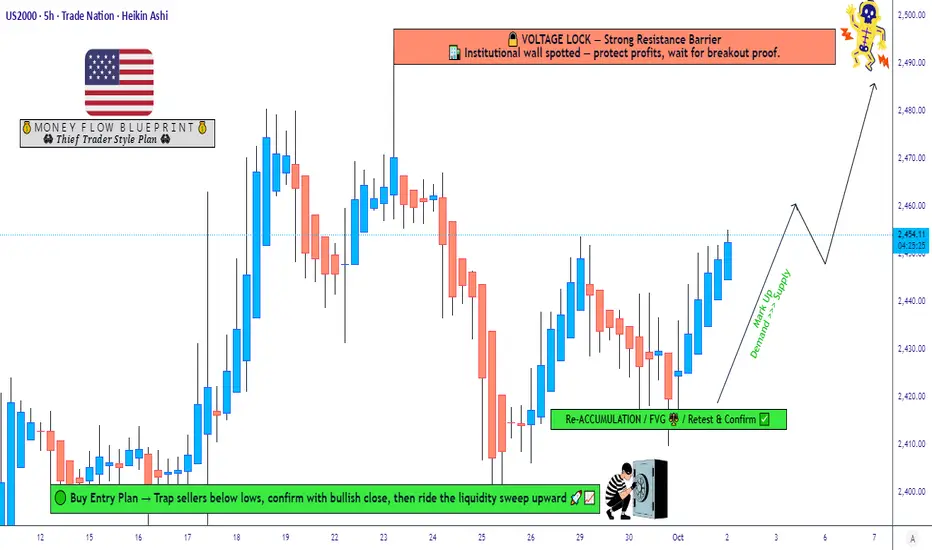
Can Small Caps Outperform as US2000 Approaches Resistance?📊 US2000 Index – Market Wealth Strategy Map (Swing/Day Trade)
Ladies & Gentlemen (Thief OG’s) – here’s a fresh layering entry plan for US2000 with a bullish outlook. This is my playful "Thief Strategy" style — multiple entries, multiple chances, and yes… multiple exits too. 😎
🔑 Plan: Bullish Bias
💸
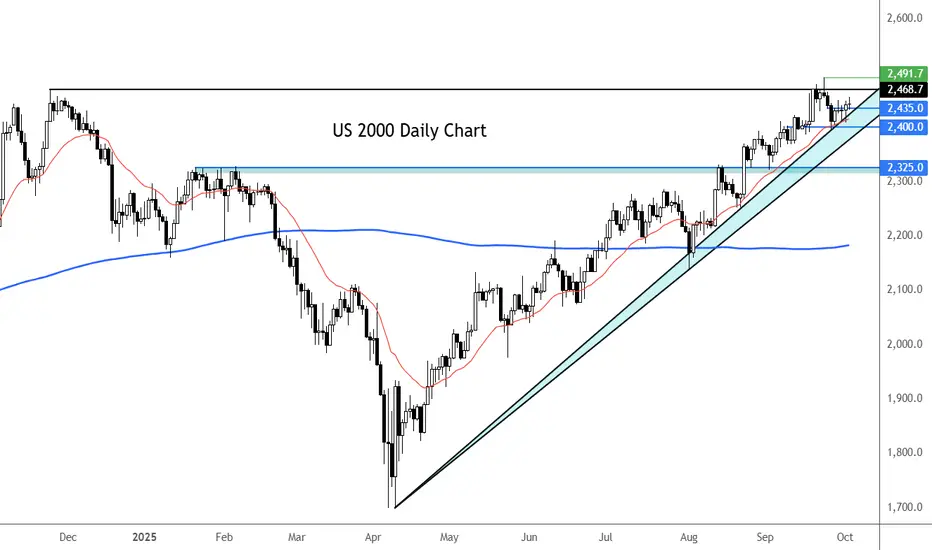
Bearish Divergence Builds in U.S. Small CapsThe U.S. small-cap contract has struggled above 2492 recently, delivering multiple failed bullish breakouts from the high established on September 23. With bearish divergence between price and RSI (14) evident, the longer this iffy price action persists, the more it may encourage bears to seek out a

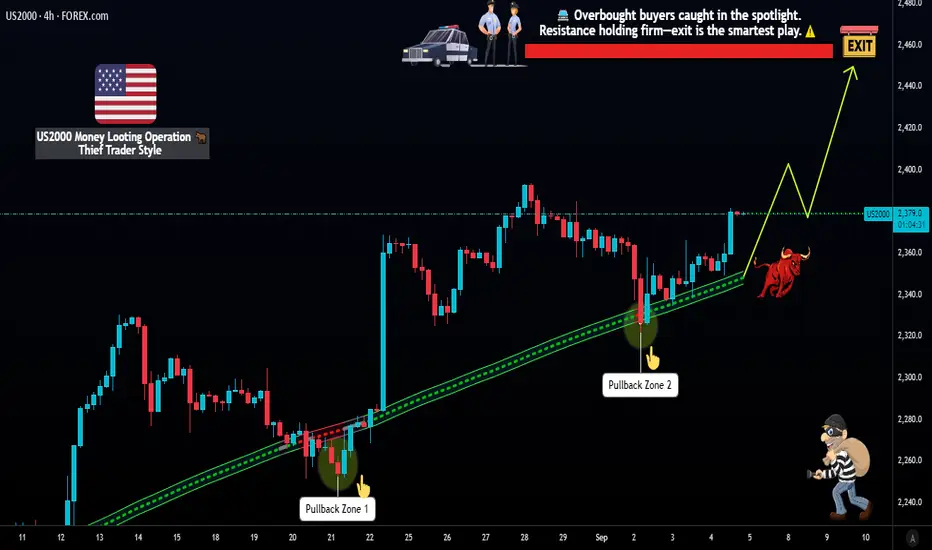
US2000 Layered LSMA Pullback Strategy – Bullish Opportunity🚀 US2000 Index – Thief Plan: LSMA Pullback + Layered Entries 📊
📌 Trading Plan (Swing / Day Trade)
Strategy: Bullish LSMA moving average pullback plan 📈
Thief Style Entries (Layering Method):
Multiple buy-limit layers at 2340 / 2350 / 2360 / 2370
You can increase layers based on your own strategy &

See all ideas
Summarizing what the indicators are suggesting.
Oscillators
Neutral
SellBuy
Strong sellStrong buy
Strong sellSellNeutralBuyStrong buy
Oscillators
Neutral
SellBuy
Strong sellStrong buy
Strong sellSellNeutralBuyStrong buy
Summary
Neutral
SellBuy
Strong sellStrong buy
Strong sellSellNeutralBuyStrong buy
Summary
Neutral
SellBuy
Strong sellStrong buy
Strong sellSellNeutralBuyStrong buy
Summary
Neutral
SellBuy
Strong sellStrong buy
Strong sellSellNeutralBuyStrong buy
Moving Averages
Neutral
SellBuy
Strong sellStrong buy
Strong sellSellNeutralBuyStrong buy
Moving Averages
Neutral
SellBuy
Strong sellStrong buy
Strong sellSellNeutralBuyStrong buy
Displays a symbol's price movements over previous years to identify recurring trends.
Frequently Asked Questions
The current value of US Small Cap 2000 Index is 2,461.4151 USD — it has risen by 2.54% in the past 24 hours. Track the index more closely on the US Small Cap 2000 Index chart.
US Small Cap 2000 Index reached its highest quote on Oct 6, 2025 — 2,501.9181 USD. See more data on the US Small Cap 2000 Index chart.
The lowest ever quote of US Small Cap 2000 Index is 106.0700 USD. It was reached on Oct 28, 1987. See more data on the US Small Cap 2000 Index chart.
US Small Cap 2000 Index value has decreased by −1.36% in the past week, since last month it has shown a 1.63% increase, and over the year it's increased by 12.46%. Keep track of all changes on the US Small Cap 2000 Index chart.
The top companies of US Small Cap 2000 Index are NASDAQ:CRDO, NYSE:BE, and NYSE:OKLO — they can boast market cap of 25.93 B USD, 25.72 B USD, and 25.24 B USD accordingly.
The highest-priced instruments on US Small Cap 2000 Index are NYSE:GHC, NASDAQ:CVCO, and NASDAQ:WINA — they'll cost you 950.44 USD, 493.35 USD, and 428.61 USD accordingly.
The champion of US Small Cap 2000 Index is NASDAQ:RGTI — it's gained 7.32 K% over the year.
The weakest component of US Small Cap 2000 Index is NASDAQ:MCHB — it's lost −99.95% over the year.
US Small Cap 2000 Index is just a number that lets you track performance of the instruments comprising the index, so you can't invest in it directly. But you can buy US Small Cap 2000 Index futures or funds or invest in its components.
The US Small Cap 2000 Index is comprised of 1964 instruments including NASDAQ:CRDO, NYSE:BE, NYSE:OKLO and others. See the full list of US Small Cap 2000 Index components to find more opportunities.