BTC is completely unstable these last days and therefore it is difficult to predict the next moves. Using this demonstrated pattern there is a possible chance that BTC will break the current rectangle in the next 10 hours and rally towards the last line of the Fibonacci Retracement. BTC may hold at the value of 0.5 Fibonacci retracement for a few days until it...
I want to represent a possibility of forming a couple and handle pattern
Using: - Bullish Flag ; - Fib retracement; - The fact that every end of month, BTC rises on average 20%; - Considering the implementation of EIP 1559 - Ethereum on August 4th.
Combination of H&S (since January) and inverted Cup and Handle . BTC with very high risk of falling in the next few days.
The EIP 1559 implementation date (August 4th) was recently announced. This will be the first major update to the Blockchain network in years. This update aims to lower transaction fees (less money going to miners) and increase transaction speed. There is the possibility of a speculative move before the 4th of August, causing ETH to rise regardless of the price of...
The uptrend line has been broken in these last few hours. Bullish flag possibility postponed to July 20, if BTC also shows an uptrend at the time
Following the Fibonacci Regression. BTC falls until July 20th, when it hits the last line (1) = $28,000 of Fibonacci. After that BTC and all other cryptocurrencies may enter a strong uptrend by the end of the year. BTC doesn't drop more than $28,000 because there is a considerable buying force in that value
BTC value following standard Accumulation schematic #1 Wyckoff events and phases. I tried to associate the best I could with the current BTC chart. I couldn't put the photo in the description, so if you want to associate Wyckoff with BTC , please search the internet: Accumulation schematic #1 Wyckoff events and phases There is a very strong chance of this...
Using Fibonacci Regression, head and shoulders pattern. I believe that BTC plummets in the next few days and the end of July will rise again strongly.
Using fibonacci regression, dynamic resistance lines (EMA), Cadles analysis and parabolas outlining the chart boundary. There is a high chance of possibility A or B happening. This should become clearer in the next few days.
Orange line (EMA) = Dynamic resistance. This means that as long as ETH don't break a significant value from that line, a downtrend continues to exist. White downward-curved parabola = same behavior as last month = expectation that the ETH value does not exceed or walk under a white parabola. Red rectangle at the $1730 mark = strong resistance
BTC continues to fall this week and therefore other cryptocurrencies are likely to follow the downtrend. This analysis relies heavily on Fibonacci regression and major resistance/support lines. ETH is expected to maintain its current value for the next few days. This weekend ETH may go into a downtrend until the 24th of July, stopping at a value of $1,800 or...
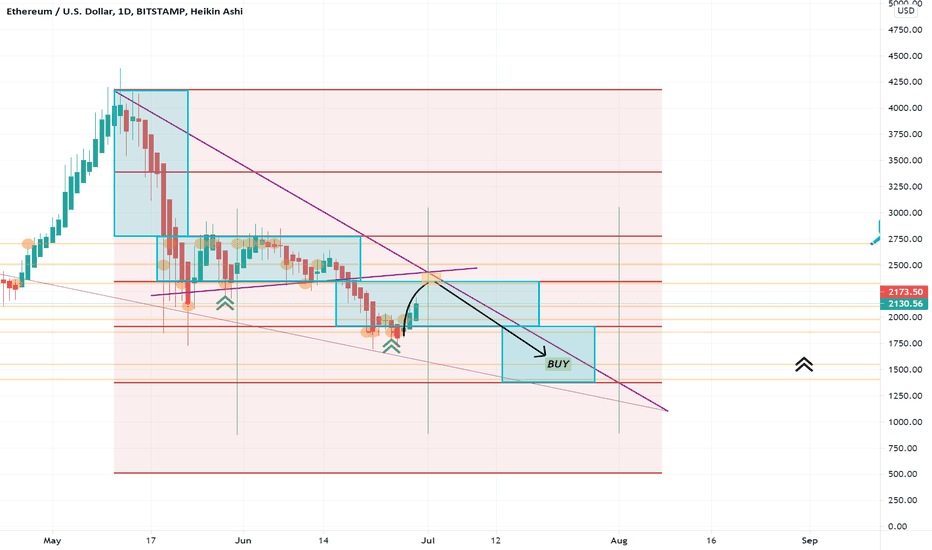
Light blue rectangles = May 10th Fibonacci Regression channels Dark blue rectangles = June 15th Fibonacci regression channels Parabolas representing the progression of ETH. Probably ETH won't be strong enough on July 5th to break through: - Last Fibonacci Regression channel of June 15th - Parabola with concavity upwards - $2700 resistance line - Purple...
ETH has shown a lot of strength over the last 50 hours breaking through the resistance lines without any difficulty. However, it is already possible to draw a curve with a downward slope under the growth. I believe that ETH will not have the inertia to break the purple lines and that's why it should drop again in the next few weeks until July 22nd to 25th...
I just copied the rate of increase at the end of the month (May to June) and positioned it on top of the end of the month now (June to July). We are experiencing the exact same rate of increase. There is a possibility that ETH will not have the strength to break the next resistance lines (red rectangles) and therefore this increase may last up to 3 days longer...


