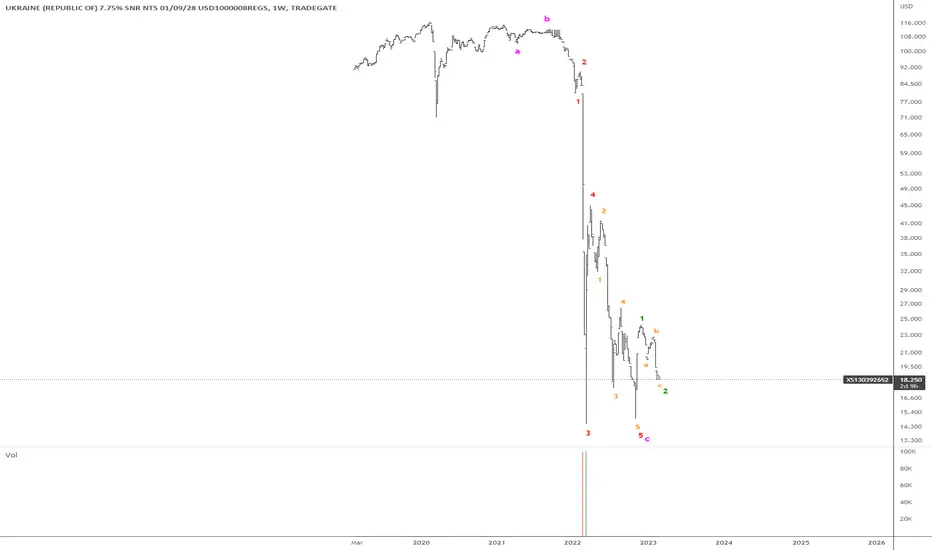
Ukraine bondsThere is clear 5 wave impulse down and clear initial impulse up which has a-b-s correction. What else needed for long?
Government bonds
US10Y 2024 FULL YEAR FORECASTI will start forecasting full years in advance
and provide updates from there finally understand how the bond markets works
dont be fooled folk 2024 nasdaq is crashing market is overbought the recovery was too quick
easy come easy go and only the informed are preparing their shorts
if u appreciate my work
like, tip, comment, follow

US10Y - Sloppy Bearish BiasThe weekly range spans from 4.570% - 4.739% and with the weekly EQ being tagged alongside buyside getting swiped, I am scoping out for the daily order block which is near the weekly sellside @ 4.593% and the second target being the lows at 4.570%.
Some form of a pullback into the lower displacement weekly fair value gap is a projection for throughout the trading week is logical to expect, especially during volatile days where there is a lot of news releases.
Also to note, the Sep - Oct 2023 weekly liquidity void is also a area of importance, especially the consequent encroachment which already aligned with the daily order block so during the week I will update this post if bias has changed.

US 10Y TREASURY: space for further relaxation?During the previous period the market was trying to price its expectations of a less than three rate cuts during the course of this year, giving up on the Fed's announcement from the latest FOMC meeting. The meeting held on May 1st, showed that the market was right in its assumptions, considering that the emerging US inflation might put halt on rate cuts this year.
This was also confirmed by the Fed Chair Powell in an after the meeting speech, considering that the Fed will stay devoted to the 2.0% inflation target. Treasury yields reacted during his speech, however, the major impact on 10Y Treasury yields had an April jobs report. The weaker than expected nonfarm payrolls, as well as, increased unemployment to 3.9% in April from 3.8% posted for the previous month, were main triggers for 10Y Treasury yields to reach the lowest weekly level at 4.45%. Still, they are ending the week at 4.51%.
The market will slowly digest the new information during the week ahead. Still, some further relaxation in the 10Y Treasury yields might be expected. However, they first need to test the 4.5% level before they start their move toward the 4.4%.

Powell pullback as Fed will slow QT.The critical support level to watch here is the 50-day MA at 4.38%, as a failed break below this yield will allow yields to spike to 5% off the back of a continued sell-off in US long-term paper despite the Feds efforts to aid the US bond market. Keep an eye on the tail in this week’s US 10-year note auction!
The markets were hit by a dovish FOMC statement last week. US bond yields and the dollar tumbled off the back of the increased bets for rate cuts in 2024. The Federal Reserve (Fed) kept the federal funds rate unchanged at 5.50% but the real dovish sentiment started flying when the Fed announced that they will slow their balance sheet taper to $25 billion, down from $60 billion, per month. That is a whopping $35 billion that will technically be injected into the market. The dovish FOMC meeting was followed by a weaker than expected ISM manufacturing PMI print along with a feeble non-farm payrolls print of 175 thousand in April, down from 315 thousand in March. These data prints along with the recent weak US GDP results is increasing the odds for a Fed rate cut sooner rather than later as the Fed may be forced to stimulate the economy before they reach their lauded 2% inflation target. On top of all this, last week US regulators announced the first US bank failure of the year with Philadelphia-based Republic First Bank being forced to close its doors.
The week ahead will allow markets to digest the Fed’s more dovish stance as there are no major data prints on the calendar. The US 10-year and 30-year bond auctions will be the main attraction for the week ahead and we will be able to gauge whether investor appetite for long-term US debt has improved following the latest monetary developments. The recent demand for long-term US paper has been fragile with long tails forcing dealers to pick up the slack in the US bond market

US Bond Yield SMT DivergenceThis chart shows the bullish SMT Divergence happening across the US Treasury Bond yields.
According to the ICT methodologies this could indicate a potential continuation for the DXY Index higher.

The future of Interest RatesRough map pf rate expectation without pretension of accuracy for dates nor timing...

Short 20Y Yield, long 20Y futures: Bias viewDisclaimer 1: This is a bias view. I think that 20Y yield (as well as 10Y) will be going down.
Disclaimer 2: Note that this is the 2nd time this year I am calling for longer duration yields to go down (linked in this analysis).
Analysis portion:
1. H&S formation.
2. Completion of double combination of zig-zag.

When the 2s/10s Chart Goes Red The Market is Dead $US02Y $US10YAs you can see there is a strong correlation between this predictive chart algo and the bond market steepening predicting the recession before the reason why. Now maybe this time is different. Maybe the massive stimulus during covid will give a false positive here. I just doubt it.

Golden Cross approaching for US 20 Year Bond YieldsGolden Cross approaching for US 20 Year Bond Yields in advance of the Federal Reserve's Wednesday Meeting and Friday's Unemployment and ISM PMI Reports. TLT to low 80's over next few weeks?

Rates not looking to slow down, but have to be lowered, dilemma Short term #yield is higher.
Long term has turned & are catching a bid.
At the moment it doesn't look like they're going down any time soon & that is not good longer term.
Was speaking with loan officer yesterday & they believe they must lower before election. But, what if it goes higher before it goes lower?
TVC:TNX

Fat finger buys on US10y in Asian sessionThe early morning Asian sessions saw some peculiar moves with the USDJPY pair falling to a low of 154.56. There are rumors of possible FX intervention from BoJ to save their vulnerable Yen. Simultaneously, there was strong buying pressure for the US 10year which is pulling yields down aggressively.
The US 10-year yield is showing signs of pulling back following the strong selling pressure since March and we should keep a hawk’s eye on yields given the volatility on the USDJPY pair.
I however expect the broader treasury sell-off to continue as long as the Fed stiks to its current hawkish stance. Big data is on the calendar as well with the FOMC statement and the US NFP's. A failed break below 4.50% will allow the US 10-year to return to the 2023 high of 5% in my opinion.
The yen is a particularly important domino in the current financial system since it is the carry trade currency of choice and Japan is also the biggest holder of US treasuries with roughly $1,500 billion US treasuries on their books. Intervention methods to save the yen will either be to sell-off US treasuries or increase interest, both of which cause the carry trade margin to decrease which will severely rattle the foundations of the financial system. The carry trade has been an exceptionally profitable one since the inception of casino capitalism as it allows investors to borrow (sell the yen) at 0% interest and then re-investing those borrowed funds into higher yielding bonds. This system is however showing sign of fragility and fx intervention from Japan may just close the buffet on this free lunch…

US 10Y TREASURY: all eyes on FedReleased data for the US economy during the previous week could point to the stagflation moment in the US during the course of this year. Posted data for core Personal Consumption Expenditures Price index show that in March it increased by 2.8% on a yearly basis, from 2.6% expected by the markets. At the same time, the first estimate for the US GDP Growth Rate was 1.6% for the first quarter of this year, while the market was expecting to see the figure of 2.5%. As it is evident that the inflation will persist during the course of this year, markets have decreased their expectations on three rate cuts for this year. As per CME Group FedWatch gauge, the market is currently estimating two rate cuts with a 44% probability rate.
One more week markets spent eyeing higher yields for US Treasuries, in order to adjust their previous estimates to new available information and sentiment. Although 10Y Treasury yields started the week around 4.6% level, they were looking for the higher grounds during the week, reaching the highest weekly level at 4.73%. Still, yields relaxed a bit during Friday`s trading session, when they returned to the level of 4.66%. The market nervousness will continue during the week ahead, considering that the FOMC meeting and Fed's rate decision is scheduled for the 1st May. Any new information that Fed Chair Powell shares with markets will be immediately priced through yields. Based on current charts, there is some probability for yields to reach 4.8%, but it should be taken with precaution. On the other hand, there is also high probability that yields have peaked, and that some relaxation might be expected in the coming period. What is certain at this moment, is that markets will continue to trade in a nervous manner until they finally hear the Fed's decision and their perception on the US economy and potential future rate cuts.

Time to short 10 YR YIELDS and Long TLT? 🤔
1O YR yields may have topped and are retracing. Yields are rolling down ⤵️
TLT is up ticking 📈 as yields come down as expected 🧭

US 10Y yields higher than Greek 10Y YieldsIn case you missed the memo....
US 10 Year bonds have a higher yield than Greek 10 Year ones..

US10Y - Continued LongsMy projection for this week was a bit late but nonetheless, bullish projections of lowest displacement fair value gap was the target and yields achieved it, topping out just before CE was met @ 4.696%. Shortly after, yields witnessed a sharp paintbrush retracement mid week and never closed out higher than the highs printed on Wednesday 17th April 2024.
On Friday, the last trading day for the week yields experienced a sellstop raid, taking out this week’s whole sellside range whilst closing bearish but up 90% from the manipulated downside sweep indicating that buystops is next on the horizon. The daily order block was also respected @ 4.593% with Fridays candle body closing above that price point as well as above the weekly Sep - Oct 23 liquidity void.
My philosophy is simple...
Fortify Michael J Huddlestone's concepts that I have studied to consistently predict where the market is more likely to go.
This includes;
- Market Structure
- Buyside/Sellside Liquidity
- Order Blocks
- Liquidity Voids
- Fair Value Gaps
- Optimal Trade Entry
- Premium/Discount Array
- SIBI/BISI
- Many More!
The strategies mentioned here are some of many that I use to implement into my analysis and over time, with consistency I aim to achieve a high degree of accuracy in the markets with the foresight and understanding to assess what went wrong when my bias is negated.
Credits;
- Michael Joe HUDDLESTONE
- Shawn Lee POWELL
- Toray KORTANOn that note, I am expecting further bullish price action, attacking the consequent encroachment @ 4.735% with a possibility that the buy programme will elevate price action up to 4.80%, upper displacement weekly fair value gap.
On that note, I can expect a selloff in bonds as yields and bonds tend to have strong reverse correlation.

10 Year to 5% or 5.5%10 year looks to be heading to 5 or 5.5 %. MACD and RSI showing upward trend on weekly still. Upward fib extension looks to retest previous high or beyond if Fed doesn’t lower rates anytime soon. Looking for CPI prints to see whether Inflation is going back up which may impact 10 year and I believe the market will continue down while 10 year heads upwards so I’m short the market.

Bund ProjectionsSometimes a drawing can speak better than words, or at least present an idea in a better and more efficient way. This project involves projected tendencies and forces that might affect the price, represented with the curves as attractors and influencers with their respective arrows pointing the direction of the potential simulated pressure applied to the tendencies of the market.
Rectangles are projected potential support and resistance in their respective time zone. The white one is different, the exception to the rule, but it could end up having some interesting price action near it (/if the price reaches that zone).
The purple cross is interesting with it's time stamp for a potential time zone of interest, while it's marked price level could be relevant if the price reaches it in this project. Orange rectangle is the wild card which could end up being irrelevant as trying to predict potential simulated scenarios of evolution of price action is not a concrete and exact science and we deal with probabilities and tendencies.
The purple monster curve wishes to be the big kahuna of the project if it ends up being a success, meaning relevant price action is to be watched near it. All elements can provide signals through Japanese Candlestick analysis and hunt for inflection points / reversals, but the purple one could be the big showdown whether it is a bounce, or a break and retest, the function of the curve is applied with the intention of catching as many as possible potential simulated scenarios and unfoldings of events.
Nen projects are for recreational purposes only and the authors are not liable in case of loss of capital caused by the trading decisions inspired by them. Every trader is responsible for his own trades and decisions. May the force of profits be with you!

Time to short 10 YR YIELDS and Long TLT? 🤔1O YR yields may have topped and are retracing to 4.4%. ⤵️
TLT which have an inverse relationship with the yields are reversing back up. 📈
Time to short 10 YR YIELDS and Long TLT? 🤔
🧭
👇

Analysis of US 10-Year Treasury Bonds (US10Y)Introduction:
I won't have many comments on the US 10-Year Treasury Bonds (US10Y) as the statements made by Chairman Powell could alter the chart. In my estimation, it seems unlikely that there will be further interest rate cuts for a while, which could have positive implications for the price of gold.
Technical Analysis:
The chart for US 10-Year Treasury Bonds (US10Y) could experience volatility due to uncertainties. However, the statements made by Chairman Powell could have a significant impact on the markets. Therefore, short-term movements in bonds may not be predictable.
Risk Warning:
This analysis does not constitute investment advice and is based solely on personal opinions. Due to market volatility, investors should conduct their own research and consider their risk tolerance.

US 10Y TREASURY: first cut in September? To be or not to be – the rate cut this year? The markets switched their expectations from March and May toward September, although currently not with high certainty. Recent data show still high resilience of the US economy on tight monetary policy. Retail sales in March were increased by 0.7% on a monthly basis, which was a figure much higher from 0.3% expected by markets. For markets, this information means that the inflation might pick up further, so the Fed will be reluctant to cut interest rates. Still, Friday trading session brought some strong corrections in 10Y US yields. Although Treasury bonds were traded at 4.69% at their weekly peak, they slipped on Friday till the level of 4.5%. Still, yields are ending the week at 4.62%. The modest drop in yields during Friday was the result of developments in the Middle East, however, the markets swiftly corrected their view, turning it toward the current fundamentals.
Aside from fundamentals which are not quite favored by markets, the geopolitics will continue to have their own influence on markets. In this sense, some relaxation in 10Y Treasury yields should be expected, however, they will react to any negative news related to the Middle East crisis. Markets will continue to weigh on the risks from this side.

Possibly a bit lowerUS10Y possibly heading lower towards 4.30 after a huge spike all the way to 4.70

US 10-year yields back to 5%The US treasury market is becoming agitated at the latest Fed stance that rates may most likely remain unchanged through the 2Q2024 and 3Q2024 which has put upward pressure on the US treasury yields. US 10-year yields broke back above 4.50% last week and a continued sell-off will see yields spike back to 5.00% for as long as the current Fed narrative holds it ground. Additionally, the 50-day MA has crossed above the 200-day MA, the infamous golden cross.
