This ship is goin down some before breakoutConstant rejection every leg up, looks like the bears are going to take the cake on last time before the next break out. Going short!
TP1 .037
TP 2 .034
TP 3 .030
GALAUSDT trade ideas

HODL GALA HODL GALA FOR ALT SEASON Q1 2025
1. CrowdSwap predicts that the price of GALA will be around $0.2989 by 2025, indicating a significant increase from its current price.
2. CoinCulture estimates a more conservative value of approximately $0.1739 by 2025, but still suggests potential growth.
3. Blockchain Reporter forecasts a range between $0.073 and $0.088 for 2025, which, while lower, still indicates a positive trend.
4. Changelly provides a prediction of $0.1364 by 2025, suggesting a steady increase.
5. Flitpay offers a more optimistic outlook with a maximum price of $0.93 by 2025.

GALA - Ranging market giving LONG Trade opportunityBINANCE:GALAUSDT (12H CHART) Technical Analysis Update
GALA is currently trading at $0.03845 and price has hit the support, price has been in the ranging market for more than a month. I'm expecting the price to bounce back from the support and hit the resistance zone. This will give a nice profit in a long trade.
Entry level: $ 0.03846
Stop Loss Level: $ 0.03482
TakeProfit 1: $ 0.04046
TakeProfit 2: $ 0.04201
TakeProfit 3: $ 0.04470
TakeProfit 4: $ 0.04930
Max Leverage: 5x
Position Size: 1% of capital
Don't forget to keep stop loss.
Follow Our TradingView Account for More Technical Analysis Updates, | Like, Share and Comment Your thoughts.
Cheers
GreenCrypto

Gala Gala Gala.... Bullish?What a fall from grace Gala has been, since its $0.086 high in March.
All indicators are bullish so I wasn't expecting the price to fall below a monthly support of $0.039, but on June 09th it did just that, and fell down to a weekly support level of $0.034 - which also happens to be the Fib 0.786 support level.
We are in the midst of the psychological warfare that is crypto, when crypto looks bullish people leverage and then we get a liquidity grab which is what happened on June 09th, now we are hear so everyone thinks its going down so they short the market and right now we are on that psychological level of 'What next' the 'Unknown'....
I'll put my bets on.... we are going up!
Don't leverage here, this is where you get your popcorn out, this is where people get wrecked.

Approaching the support area at $0.3500The price of GALA is currently consolidating and approaching the support area at $0.3500. Expect some sideways movement before the next significant move. The resistance area is at $0.5000.

Long signal for GALA/USDTThis technical analysis is based on the daily chart of BINANCE:GALAUSDT on the Binance exchange. This analysis draws two price channels and evaluates support and resistance levels.
Price Channel Analysis:
The previous bearish channel is broken out, and a bullish channel is formed.
The suggested entry point is around 0.04303 USDT.
Entry and Exit Points:
Entry: 0.04303 USDT
Take Profit: 0.06312 USDT (46.74%)
Stop Loss: 0.03710 USDT (13.79%)
R/R Ratio: 3.39
Conclusion:
This analysis suggests that by adhering to the specified take profit and stop loss levels, a successful trade can be achieved. The Reward/Risk Ratio for this trade is approximately 3.39, indicating a highly favorable risk-to-reward scenario. To manage risk effectively, it is recommended to strictly follow the stop loss level.

#GALA/USDT breaks the Diagonal Trendline in Daily TF!#GALA/USDT breaks the Diagonal Trendline in Daily TF!
INDEX:GALA is consolidating in a range. #GALAUSDT needs to clear the PMH $0.05 resistance level to gain bullish momentum. Wait for that resistance BO to long it.

GALA: Ready for a run? We can see that price is compressing here trying to breakout
If we can break it's local resistance at .0475, possibly it can shoot up straight towards .0497 (poor high) to .052 sweeping those local highs
Any rejection or fakeout we get at the mentioned levels, we'll be looking to re-enter at .040-ish for a possible three-drive setup
Let's see how this trade unfolds, will re-assess once we get a reaction at .0475

#GALA Why Enter This Trade...Why Enter This Trade...
In the provided chart for the #GALA/USDT, several factors make this trade particularly attractive:
1. Symmetrical Triangle Formation: The chart shows the formation of a symmetrical triangle, which is a pattern indicating potential breakout points. This is marked by the convergence of the downward trendline and the upward trendline, suggesting a forthcoming significant price movement.
2. Breakout Potential: The price is currently testing the upper boundary of the triangle. A breakout above this line, especially with strong volume, can lead to a substantial upward movement.
3. Support and Resistance Levels: The support level is marked at 0.03414, and the resistance level is set at 0.06197. These levels provide clear targets for setting stop-loss and take-profit orders, minimizing risk while maximizing potential returns.
4. Volume Analysis: There is a noticeable increase in trading volume, which often precedes a breakout. High volume indicates strong market interest and can validate the breakout, reducing the likelihood of a false move.
5. RSI Indicator: The RSI (Relative Strength Index) is not in the overbought zone, suggesting that there is still room for upward movement before the asset becomes overvalued. This indicator provides additional confirmation of the potential for a positive price move.
6. Risk-Reward Ratio: The defined take-profit level at 0.06197 offers a favorable risk-reward ratio. This makes the trade appealing, as the potential reward significantly outweighs the risk, assuming proper risk management practices are in place.
In conclusion, while technical analysis points towards a potential breakout and a profitable trade opportunity, it's essential to remember the inherent risks. Set a stop-loss at the support level (0.03414) to limit potential losses if the market moves against the trade. Always combine technical analysis with proper risk management to optimize trading outcomes.

Next resistance area at $0.0400GALA recently tested the support area at $0.03380, which acted as a strong level of buying interest, causing the price to bounce from this level. This rebound indicates that buyers are stepping in to defend the support, suggesting potential bullish momentum. As a result, we may see the price continue to rise towards the next resistance area at $0.0400.

Bear Takeover Bears have taken control!
If/when it breaks .034 support we could be looking at a bottom of .026 maybe even flash crash down to .021.

Gala 1.42B Breaker support bounce possibleI could see Gala come down and get the bounce.
Theres a nice orderblock with imbalance below.
theres some good confluence with the 618 above and POCs.
I have no idea what lies ahead but these levels will more than likely get respected.
Not Ever Financial Advice.

Apex zone is being broken by triangle patternOn day TF
Gala is moving to apex zone and will break triangle pattern soon.
Wait for breakout

GALA/USDT Has Broken Out of Symmetrical Triangle | What's Next? 💎#GALAUSDT has impressively broken out from a Symmetrical Triangle and is now testing a pivotal level where resistance has transformed into support. The Point of Control (POC) of the VRVP Channel solidifies this support, enhancing our bullish outlook.
💎If #Gala holds this retested support at $0.0373, we expect a vigorous rally fueled by the momentum at this critical juncture.
💎Conversely, if INDEX:GALA loses its grip and retreats below this newfound support, it might signal a resurgence of bearish trends, pointing to a possible descent to the next vital demand zone at $0.0336. This level is renowned for its liquidity and history of triggering strong bullish recoveries.
💎If #GALA revisits this demand zone, securing a strong rebound is essential to sustain support. A failure to rebound might amplify bearish forces, deteriorate market sentiment, and lead to further price declines.
💎Keep your trading strategies flexible and your senses sharp, Paradisers. Your ParadiseTeam is closely monitoring the market, ready to navigate you through the dynamic developments in the #Gala market.
MyCryptoParadise
iFeel the success

GALA priceGala token is on the verge of a range breakout and might reflect a short term rally above the $0.0500 mark ahead.

GALAUSDT Trend Line Breakout!GALAUSDT Techncial analysis update
The price of GALA is breaking its trend resistance line on the 4-hour chart. The price has touched the trend resistance line multiple times before giving a breakout.
Buy zone : Below $0.0455
Stop loss : $0.0415

GALA New Bullish Wave Is Started📈 Finally Today The Price Breakout From The Important Resistance Area And Trend Lines, Now I Can Say New Bull Rally Started By More Confidence And I Expect Bullish Move From Here Toward a 0.06650$ And 0.12$ As a Next Targets

GALA: strat bullish trend ?📊Analysis by AhmadArz:
🔍Entry: 0.04548
🛑Stop Loss: 0.04265
🎯Take Profit: 0.04847 - 0.05102 - 0.05434 - 0.05813
🔗"Uncover new opportunities in the world of cryptocurrencies with AhmadArz.
💡Join us on TradingView and expand your investment knowledge with our five years of experience in financial markets."
🚀Please boost and💬 comment to share your thoughts with us!

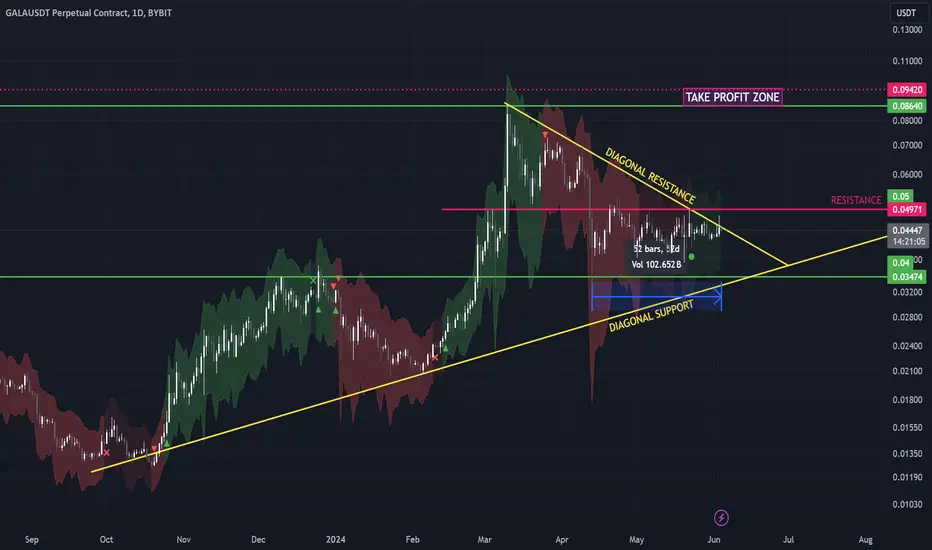
Potential Long Position on $GALACurrent Indicators:
Weekly Support: We are currently above the weekly support level at $0.03474.
Yellow Diagonal Support Trendline: The price is holding above the yellow diagonal support trendline.
Accumulation Zone: We've had 52 days of price accumulation, with the price bouncing within a range.
Momentum Indicator: The "Squeeze Momentum TD - A Revisited Version of the TTM Squeeze" is currently dark green, indicating a mildly bullish sentiment.
Overall Trend: We are in an overall uptrend.
What's Missing for Confirmation:
Break Above Diagonal Yellow Resistance Trendline: We need to see a break above this key resistance level.
Break Above Key Resistance at $0.04971: Clearing this resistance would further confirm a bullish trend.
Target Price (TP) Zone:
TP Zone: $0.09 area
Conclusion:
If we break above both the diagonal yellow resistance trendline and the key resistance at $0.04971, this presents a very good long opportunity. Keep an eye on these levels for confirmation.
$GALA BREAKOUT !!#GALA is breaking out from a Symmetrical Triangle pattern on the 12-hour time frame 👀
Following the breakout, a bullish wave is anticipated 📈
BINANCE:GALAUSDT
☺ FOLLOW US FOR MORE ANALYSIS ☺

GALA ANALYSIS🚀#GALA Analysis :
🔮As we can see in the chart of #GALA that there is a formation symmetrical triangle pattern. Also there is a perfect breakout. But there is an instant resistance zone and if #GALA sustain this breakout and also breakout the major resistance zone then we would see a bullish move📈📈
🔰Current Price: $0.04740
🎯 Target Price: $0.08253
⚡️What to do ?
👀Keep an eye on #GALA price action. We can trade according to the chart and make some profits⚡️⚡️
#GALA #Cryptocurrency #TechnicalAnalysis #DYOR

GALA bullish or bearish?Looking for a break out of this triangle i’ve drawn up. Resistance and support seem to be around 0.051 and 0.035. I’m feeling over all more bullish since a lot of weekly stoch rsi have reset now in the broader crypto market. That’s just one of many indications though. Anything could happen. If we don’t pop soon. Then more side ways is unfortunately underway. Also looking for quick wick down before possible rocket reverse. We still need more new crypto buyers and less negative media to get a party going.
Also… The 12 hr for GALA looks like an inverse bart simpson pattern. Since it’s formed a solid bottom with inefficiency in the opposite direction. Time will tell for how strong GALA is though. I’m long around here 0.044 looks convincing. I’d be pretty concerned if we loose the big support around 0.036 though.
Let’s see how this plays out this week.

GALA intent to go UP is obvious now.GALA went up generously this past few hours -- conveying its intent to reverse to the upside based on the daily data.
This is huge. Daily data doesn't change mind often, so this is a good hint already.
Expect some more than average moves to the upside from the current levels.
Spotted at 0.030
TAYOR.
safeguard capital always.
