USOIL FORECAST Q2 2024 : 16-18% BULL RUN Oil fundamentals by seeking alpha
i cant copy and paste go and see the article and diagram for yourself
seekingalpha.com
USDWTI trade ideas


Crude oil under pressure 80.3 return rangeCrude oil technical analysis
Daily resistance 79.2-83.4, support below 77.5
Four-hour resistance 79.2-80, support below 78.5
✅Crude oil operation suggestions: Crude oil fell back after reaching a high yesterday. It failed to continue its strong performance after breaking through 80.0. The small negative line retreated and showed signs of seeking support at a lower level. In a strong market, the price usually falls back on the same day. Yesterday, it fell back and closed at a low level, which made the short-term bulls not strong. It still returned to a volatile trend. Be careful of today's rapid rise to repair the decline.
The overall price continued to fall back after encountering resistance above the 80 mark. The short-term daily level continued the rhythm of long and short wide fluctuations. Today's upper resistance focuses on the opening of yesterday's hourly line near 80.3-80.5, and the lower support focuses on the 78.5 line. During the day, keep selling high and buying low according to this range.
BUY:79.2 near SL:79.00
BUY:78.5 near SL:78.00
The crude oil brokers' quotations are different, only for reference of trading direction

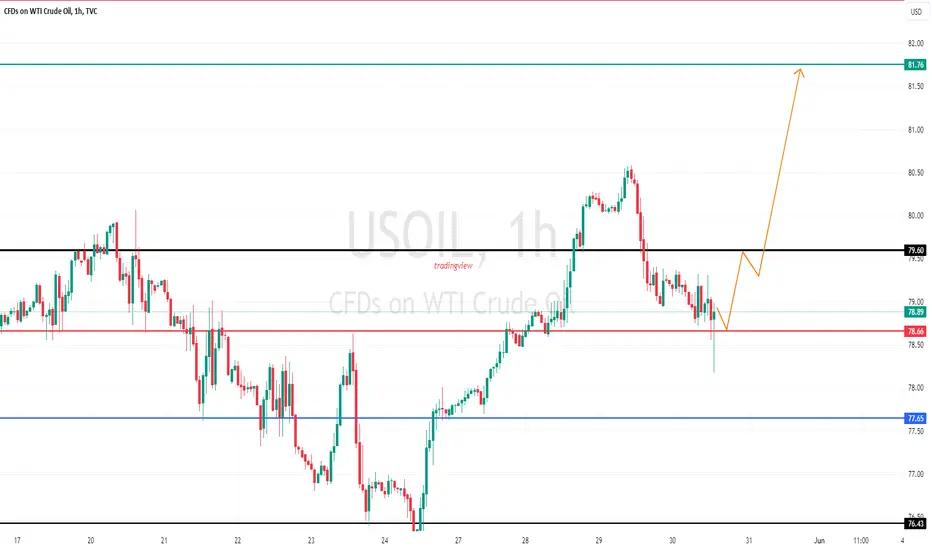
USOIL Resistance Rejection ? 27.05.2024- 1-hour USOIL chart shows resistance rejection.
- If rejection holds, price likely to go down.
- If rejection fails and breaks out to the upside, price likely to go up.
- Apply risk management.
Risk Warning: Trading in CFDs is highly speculative and carries a high level of risk. It is possible to lose all of your invested capital. These products may not be suitable for everyone, and you should ensure that you fully understand the risks taking into consideration your investment objectives, level of experience, personal circumstances as well as personal resources. Speculate only with funds that you can afford to lose. Seek independent advice if necessary. Please refer to our Risk Disclosure.
BDSwiss is a trading name of BDS Markets and BDS Ltd.
BDS Markets is a company incorporated under the laws of the Republic of Mauritius and is authorized and regulated by the Financial Services Commission of Mauritius ( FSC ) under license number C116016172, address: 6th Floor, Tower 1, Nexteracom Building 72201 Ebene.
BDS Ltd is authorized and regulated by the Financial Services Authority Seychelles (FSA) under license number SD047, address: Suite 3, Global Village, Jivan’s Complex, Mont Fleuri, Mahe, Seychelles. Payment transactions are managed by BDS Markets (Registration number: 143350)

WTI in daily chart Hello
I don't think it is necessary to repeat same expressions because it is really boring. What is happening in OIL market is to decrease the price and increase the sell power to balance it.
WTI was able to penetrate into our resistance level and it is making a first wave. We traders should change our decisions whenever it is necessary and never insist in our ideas. For now I am following the bearish market for Oil. I am not sure how long it can correct (may till Trump becomes US president) and we have to decide fir short-term because Oil (as I mentioned in my last ideas) is in a consolidation (range) are with many R/S level.
Thanks

Oil Down TrendMy first analysis on US Oil.
We are in a clear downtrend on the monthly time frame and price continues to make lower lows on the lower tome frames (4HR - 1 W).
Short term pullbacks offer selling opportunities.
Keep in mind that over the following week we have the following news data:
June 3 - June 7:
Final Manufacturing PMI
ISM Manufacturing PMI
JOLTS Job Openings
ADP Non-Farm Employment Change
ISM Services PMI
Unemployment Claims
Average Hourly Earnings m/m
Non-Farm Employment Change
Unemployment Rate

WTIin the pic u see that our downtrend was broken with good impulsive move out
after that i stay like snake to hunt it
the price come to my zone
now if i see good confirmation i will long wti

WTI New Trend BeginningWe can see on the 4H that the downtrend has been broken, waiting for a confirmed retest of the old trendline before entering. We could see consolidation for a little while however. Swing trade.

crude oilCrude oil is currently on main wave B of an A,B & C correction, pair has completed sub-wave A & now its currently on towards sub-wave B is about to be confirmed as pair is expected to breakout towards minor-wave 5 of sub-wave C on main wave B

USOIL Trading IdeaBased on Simple Technical Analysis ( Trendline + Support & Resistance )
Risk Disclaimer:
Please be advised that I am not telling anyone how to spend or invest their money. Take all of my analysis as my own opinion, as entertainment, and at your own risk. I assume no responsibility or liability for any errors or omissions in the content of this page, and they are for educational purposes only. Any action you take on the information in these analysis is strictly at your own risk. There is a very high degree of risk involved in trading. Past results are not indicative of future returns. Good luck :-)

USOIL Set To Grow! BUY!
My dear followers,
This is my opinion on the USOIL next move:
The asset is approaching an important pivot point 77.12
Bias - Bullish
Safe Stop Loss - 76.27
Technical Indicators: Supper Trend generates a clear long signal while Pivot Point HL is currently determining the overall Bullish trend of the market.
Goal - 78.52
About Used Indicators:
For more efficient signals, super-trend is used in combination with other indicators like Pivot Points.
———————————
WISH YOU ALL LUCK

OIL will going up around 83Oil will going up aroung 83, Buy now.
we can see Oil has Descending Braodening Wedge Pattern.

USOIL:Buy@79, target 80Affected by the geopolitical situation, crude oil bulls still take the initiative. Although there was a wave of correction after the failed move to $80, another rise is likely in the short term. Once it breaks through the 80 integer mark, it will continue to test the resistance near $82 upwards. The profit margin is still very large, and it is worth buying during the correction. Don't blindly go short before reaching 82. After all, bulls are now dominant and the risk of going short is high.


USOIL - where is current support? holding or not??#USDOIL.. market placed 80 plus day high and dropped again . now market have a supporting area here,
keep close it because if market hold it then again bounce expected from here,
don't be lazy here.
good luck
trade wisely
Short Crude OilOn Daily Chart and 4H chart we created the megaphone(broadening formation) so I would check the top boarder of the formation and look for breaking market structure.

USOILRSI indicates Bullish Divergence. Which means that at any time the market trend can change to HH and HL.
Order type : buy stop
Entry : 78.82
SL : 77.38
TP1 : 78.82
TP2 : open

Oil Prices Rally from a Six-Week NadirOil prices increased early on Thursday, recovering from a six-week low after a significant 3.6% fall the previous day, which was the lowest point since mid-March. This drop was attributed to an unexpected surge in U.S. stockpiles, indicating softer demand than anticipated.
At the same time, market observers have pointed out that the Federal Reserve has kept interest rates steady, diminishing earlier expectations for a rate cut. PVM Oil Associates commented, "The reduction in borrowing costs may not occur as soon or as quickly as previously thought. It is similar to peak oil demand—consistently anticipated yet never realized."
Technically:
The price has stabilized within the bearish zone, having already breached the pivotal range between 80.73 and 82.24. This suggests a continuation of the bearish trend, with potential targets at 77.14 and 75.35. A further break below 75.35 could lead the price down to 69.78.
Conversely, if the price stabilizes above 82.24, it may indicate a bullish trend, potentially reaching up to 86.86.
Pivot line: 80.73
Support lines: 77.14, 75.35, 69.78
Resistance lines: 82.24, 86.86, 89.08

USOIL UPDATE (long Term TRENDLINE)
Hey team, Hope you are Enjoying our ideas and Analysis Today we are monitoring USOIL Looking for Bullish Long Around 76.490
Once we will Receive any Bullish Conformation the Trade Will be Excuuted
Good luck Guy's 🤞

USOIL BEST PLACE TO BUY FROM|LONG
Hello,Friends!
Bullish trend on USOIL, defined by the green colour of the last week candle combined with the fact the pair is oversold based on the BB lower band proximity, makes me expect a bullish rebound from the support line below and a retest of the local target above at 78.53.
✅LIKE AND COMMENT MY IDEAS✅

USOILWe can attempt to buy USOIL from specified level as it break LH , also bullish divergence occur indicate that it move upward .
SL , TP mention in chart.

UsOil longUsoil looks for more buy momentum use Stop-loss we have entered after confirmation only in this pair so it may slow process but sure process

Should we wait for lower oil prices?
In the analysis of the oil chart, the main trend line of the upward movement (blue line) has been broken, and the broken candle is marked with an arrow. It seems that we have to wait for lower prices for oil.
Do you agree with my opinion?
