Crypto market
Bitcoin: Push Back To 70Ks?Bitcoin support at the 66K area continues to hold and may be the higher low (wave (iv)) that may lead to a higher high over the coming weeks (see illustration). In order for a dramatic new high like 80K to be tested, price needs to prove itself by clearing 73K first. The key to navigating this is to WAIT for the market to provide evidence (confirmation), NOT get stuck on an opinion about the future. Even though the broader trend is bullish, UNTIL it breaks out, it is within reason to expect the consolidation to continue.
Recognizing the support/resistance levels within broader consolidations can help to uncover numerous opportunities, especially on smaller time frames. For example, while I consider the 66K area a minor support on this time frame (see arrow), this location is a great spot to anticipate longs on day trade time frames like the 1 or 5 minute chart.
When using such levels as a form of context to guide decisions, traders often do not understand how to shape expectations relative to the magnitude of the time frame. For instance, price movements on a 1 minute chart are typically smaller than a 5 minute or 1 hour chart. Knowing this should shape expectations in terms of reward/risk. This is one of the problems I aimed to solve when coming up with the idea for Trade Scanner Pro by automating the exit points using the average true range (ATR).
The same can be said about the 70K whole number resistance area. This is an ideal location to WAIT for sell signals, whether to take profit or an aggressive counter trend trade short. Again the location provides a point of reference where we can anticipate a particular price behavior or opportunity. It is up to the MARKET to confirm and even then, there is a chance it can get stopped out (markets are mostly RANDOM).
My analysis is meant to shed light on a select range of possibilities over the coming week for day and swing traders. I have to remind people of this because many come to these articles expecting to gain knowledge of the future. It will take some time to realize effective risk management has NOTHING to do with where price will be in the future. There is no way to forecast the future accurately, ESPECIALLY using the limited information that is available on charts.
The idea is to help you prepare for potential opportunities that I believe have a greater probability of a positive outcome because of the price location relative to the trend. The MARKET decides what scenario will play out, not me or anyone else. To align with the market, we must have a passive mindset, good listening skills and the ability to admit being wrong QUICKLY, especially on smaller time frames.
So here is how to prepare of the coming week: IF the low 66Ks are tested, look for longs, IF 66K breaks, avoid longs and reevaluate new levels. IF 70K is tested, look to take profits, or consider aggressive shorts (counter trend). IF 70K is cleared, watch for test of 73K. How you navigate your positions is a function of your risk tolerance and personal style. Most importantly, let the market do the THINKING, you simply adjust to the new information as it appears.
Thank you for your considering my analysis and perspective.

BITCOIN - 2 SCENARIOS Hello Traders !
The Bitcoin price formed a descending triangle pattern.
We have 2 scenarios:
BEARISH SCENARIO:
if the price breaks and closes below the support level (67276 - 66259),
We will see a huge bearish move📉
TARGET: 61640🎯
BULLISH SCENARIO:
if the market breaks above the resistance line and closes above that,
We will see a bullish move📈
TARGET: 71400🎯

Lingrid | ARBUSDT ready to TAKE OFF ?After a strong bullish impulse movement, the BINANCE:ARBUSDT has been stuck in a prolonged consolidation phase. Currently, the market is trading within this consolidation zone, having broken above the crucial level of 1.1000. As the price approaches the support level, it's likely to bounce off and resume its upward momentum. The market has been in an accumulation phase since April, with a minor pullback expected to support the level before the price extends its upward trajectory, targeting higher resistance levels. My goal is the resistance at 1.3300
Traders, if you liked this idea or if you have your own opinion about it, write in the comments. I will be glad 👩💻

BITCOIN → Strong fundamentals and interest lead us to $80KBINANCE:BTCUSD reaches a strong $71500 liquidity zone as strong ETH-ETF related news is released. A trap from the market maker catches the crowd off guard and now the market is ready to move on
Toretically, the correction wave ends after the false breakdown of resistance and liquidity zone 71500. Bulls successfully hold the defense above the support 67241. Liquidation of part of traders, liquidity capture below the zone increases chances for further growth. The market holds the course towards the global resistance 73679.
Fundamentally and technically BTC looks strongly bullish, the general market background is also strong, which generally supports the theory of further growth with the possibility of ATH update. The fifth wave may be completed in the area of the current ATH, or, on the background of increased interest, may find its target area at 1.236 fibo - $81.980.
Resistance levels: 71572, 73679
Support levels: 67241, 64545
The area of 67250 - 64500 is currently an intermediate bottom, in this place, relative to the whole range, the largest amount of the asset was purchased. We are waiting for a retest of 71572 with the possibility of further breakout and growth to the previously outlined targets
CME:BTC1! CRYPTOCAP:BTC CRYPTOCAP:TOTAL
Regards R. Linda!

Bitcoin is Ready to Fall===>>Symmetrical TriangleBitcoin has managed to break the lower line of the ascending channel and is moving in a symmetrical triangle .
We can also see the Sell signal between 50_SMA(Daily) and 100_SMA(Daily) in the chart (it is a bearish sign ).
I expect Bitcoin to break the lower line of the symmetrical triangle and fall to the targets I have specified in the chart.
Important Support Zone($69,500_$68,820) : Monthly Pivot Point//Fib Cluster//100_SMA(Daily)//50_SMA(Daily) .
Note: An important point you should always remember is capital management and lack of greed.
Bitcoin Analyze (BTCUSDT), 4-hour time frame ⏰.
Do not forget to put Stop loss for your positions (For every position you want to open).
Please follow your strategy; this is just my Idea, and I will gladly see your ideas in this post.
Please do not forget the ✅' like '✅ button 🙏😊 & Share it with your friends; thanks, and Trade safe.

ONDO tries to breakout !ONDO / USDT
In LTF price is trying to breakout the mega phone pattern
If price will able to hold above resistance line in next few hours we can another bullish wave

Reminder on MATICUSDThe large triangle is forming similar to the one prior to the 2021 breakout
I expect MATICUSD to melt faces post this triangle breakout
I have posted a chart like this before but it becomes more relevant everyday
BULLISH

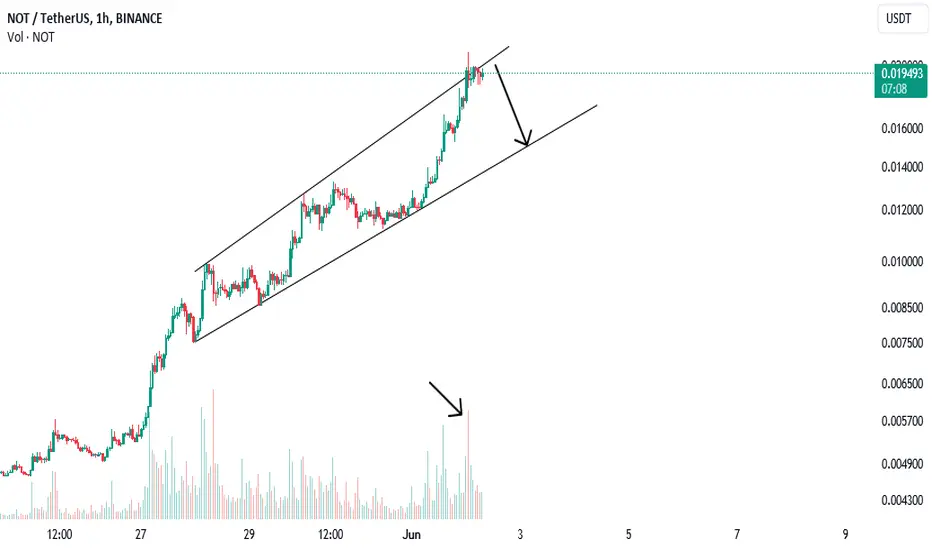
NOT/USDT set to break out to $0.05Title: NOT/USDT Poised for a Breakout to $0.05 🚀
Overview:
I've been closely monitoring NOT/USDT, and it has demonstrated a strong bullish trend, bouncing off significant support levels and breaking through key resistance points. Based on the Fibonacci retracement and extension levels, I'm projecting a target of $0.05.
Chart Analysis:
Current Price Action:
The price of NOT/USDT is currently trading at approximately $0.0211, showing significant upward momentum.
Recent bullish candles indicate strong buying pressure.
Fibonacci Retracement Levels:
I used the initial retracement from the recent low of $0.0044920 to the high of $0.0211711 to highlight critical support and resistance levels.
Key retracement levels to watch include:
0.382 Fib level at $0.009108
0.5 Fib level at $0.0092274
0.618 Fib level at $0.0103449
These levels have provided strong support during pullbacks, consolidating the bullish trend.
Fibonacci Extension Levels:
Using the Fibonacci extension tool, I project potential price targets for the continuation of the bullish trend.
Key extension levels include:
1.618 extension at $0.0191857 (already surpassed)
2.0 extension at $0.023435
2.618 extension at $0.0292865
3.618 extension at $0.0386624
4.618 extension at $0.0456128
Bullish Indicators:
The price has consistently broken through resistance levels, converting them into support.
The formation of higher highs and higher lows is a classic indicator of an ongoing uptrend.
The breakout above the 1.618 Fibonacci extension level indicates strong bullish momentum, setting the stage for higher targets.
Scalping Levels:
The blue arrows on the chart indicate potential buying levels for scalpers. These levels align with the Fibonacci retracement levels and provide ideal entry points for short-term trades.
Price Target:
Based on the current momentum and the Fibonacci extension levels, the next major target is the 4.618 extension level at $0.0456128.
A push beyond this level will likely see NOT/USDT reaching the psychological and technical milestone of $0.05.
Conclusion:
NOT/USDT is exhibiting strong bullish signals with the Fibonacci levels aligning perfectly with recent price actions. The breakout above critical resistance levels and the strong upward momentum suggest that the price could realistically reach $0.05 in the near future. I'll be watching for continued support above the 1.618 and 2.0 Fibonacci extension levels, as these will be key indicators of sustained bullish strength.
Happy Trading! 📈🚀

NOT PumpingNOT ( BINANCE:NOTUSDT ) is preparing for an explosive upward pumping, continuing its weekly rise, today it experiences a jump of 100% to 250%, the price ranges below are possible targets.
$0.02500
$0.02750
$0.03200

78980 next tp BTC now prepared for new ATH which will be around 78980 plus minus , this may be the last rally of 1st bullish rally , still time to decide , if this is last rally which confirmed triggered recession pullback of all world financial intrument to ground , floor inclu nasdaq gold


WHALES LOW VOLUME IS FINALLY HERE!You all know what happens when I receive a WHALES LOW VOLUME signal. It appeared today at 5 PM PACIFIC TIME.
For those who are new to this ForexX channel; what this means, means BULL RUN and will BULL RUN sooner than we think.
This custom indicator has been registered as HULL MOVING AVERAGE. HULL connected with trend dotted lines and up and down trend prices. Candlesticks are within the HULL MA.

Bitcoin can rebound up from support line of wedge to 69400 pointHello traders, I want share with you my opinion about Bitcoin. Observing the chart, we can see that the price some time ago entered to upward wedge, where it at once rebounded from the support line and rose to the support level, which coincided with the buyer zone and broke it. After this BTC some time traded near the 66700 level and then fell to the buyer zone, after which made a strong upward impulse to the resistance line of the wedge, breaking the resistance level, which coincided with the seller zone. But the price soon turned around and in a short time declined to the support level, thereby breaking the 70400 level one more time, after which it started to grow and later reached the resistance level again. Then Bitcoin rebounded from this level and made a correction movement to the support level again, but a not long time ago price bounced from this level and started to grow. At the moment, I think that BTC can correct the support line and then rebound to the resistance line of the wedge pattern. For this reason, I set my target at 69400 points, which coincided with the resistance line. Please share this idea with your friends and click Boost 🚀

NOTUSDT IDEAHello Traders Hope You Are Enjoying Our Analysis. Today We Will Discuss About NOT
(Analysis)
The Bullish Pennant Successfully Breakout On 1H Timeframe☑️
Running In +20% Profit So Far & I Expecting More Profit In Coming Days

BTCUSD in 15 mAnalysis in 15 minutes on BTCUSD .
We can see a bullish divergence for a possible return to 68000 initially.
Subsequently a probable pursuit at 69100...
We are in an internal liquidity plan for the moment.
Don't forget to always manage your money management

A PullBack Idea on NOTcoin | Updatewe can have a long trade in pullback! i try it :)
because of the high risk, This idea is'nt recommended, but it's suitable for the low volume of the test.
At the end of the week, NotCoin's movement will end with the closing of the one-day candle (as well as the weekly candle) in the price range of $0.03000.

🅱️ Expert Confirms: Bitcoin Set To Crash Below 30KSignals are available everywhere... And new data is coming in all of the timing.
The market is great.
Even though we get confirmation after confirmation, doubts still creeps in.
Even though we see the market moving just as we would expect it to move based on the cycle, sentiment and chart signals; confirmation after confirmation, for real.
Somehow, each time there is a small rise in price doubt creeps in.
➖ Will Bitcoin move to hit a new All-Time High next?
➖ Is the correction over?
➖ How can I be certain prices will not continue higher?
➖ How can I be certain prices will continue lower?
"Bitcoin is trading above $60,000 after all and that's pretty strong."
Well, actually, below 70K is ultra-bearish after a new ATH at 74K, but this is not the topic for this update.
In early 2022 we were discussing here on TradingView the bear-market that was developing for Crypto and how far down Bitcoin would go.
We were dead set on finding the target and as you know, we shared hundreds and hundreds of charts. All of us, the different players.
After a while, we decided that Bitcoin was going to settle around 20K because that was the 2017 ATH. We concluded that the bottom would happen in June or November 2021 and reach several others and varied conclusions.
We all agreed and everything was clear; it was early 2022, we still had a long way to go before reaching 20K; Bitcoin crashed below 20K and yes, even 15K was tested as support.
A certain public figure, I won't name any names, said in early 2022 that Bitcoin would move lower but stay above 30K. It doesn't matter what happens it would never go below 30K... Bitcoin was trading in the 40Ks at the time.
Sure enough, that was the signal...
Bitcoin crashed and did not move below 30K but went even lower and hit below 16K.
The same character is now saying that "Bitcoin will stay in $55K to $75K zone for now" ... This means that the crash is confirmed and it is going below 30K.
Namaste.

GTAIUSDT Trade ideaGTAIUSDT is in a freefall, continuing towards our projected drop target of the 61.8% Fibonacci retracement level of the entire rally around 0.7 to 0.6 range. This key Fibonacci level serves as a potential accumulation point, offering an attractive buying opportunity.
We expect a reversal or stabilization around this level, as indicated by the potential path outlined on the chart. Monitoring price action closely at this critical support zone will be crucial for timing re-entry and maximizing potential gains.

BNB Massively Undervalued? $10,000 Potential!BNB has been making some extraordinary moves last cycle, where it bottomed around $4.5 and made it to $700 during the next top.
Looking at the chart, we can clearly see that BNB follows a bullish channel pattern. My assumption is that this channel will hold and that BNB will make a move towards the top of the channel.
$10,000 is possible, it's a "mere" +5,000% move from bottom to top, as opposed to last cycle's +16,000%.
Are you bullish on BNB? Share your thoughts.


WLD Perfect Reversal Trade Soon! Keep WatchWLD has been trading alongside a bullish trendline. This trade is based on the idea that this bullish support line will hold and cause the price to reverse from there.
Stop just below the May lows, target at the current all-time high (ATH).

BNBUSDT: Strong Sell Coming Up! BINANCE:BNBUSDT
Price have been consolidating since a long time now, we are expecting price to manipulate first which will take our buy side liquidity and then after we can see price to drop strongly. Please wait first for the price to do it thing and once it takes out the buy side liquidity and with the confirmation we can enter sell entry.
**If you like our ideas, then please like, comment and follow us which will encourage us to bring you more educational ideas**
Team Setupsfx_
