Depth of market (DOM): what it is and how traders can use it
What is the order book?
The order book, or Depth of market (DOM), is a panel through which you can see how many orders are to buy and sell an asset at different prices. Let's assume that the asset price is now $1. Then, the order book will show how many orders there are for prices of $0.90, $1.10, and so on. This is an excellent tool to keep track of where supply and demand are.
How to open the order book (DOM) and start using it
- Connect your account to a broker that supports tier 2 data (e.g., TradeStation, Interactive Brokers, AMP, Ironbeam, Tickmill, Optimus Futures, Tradovate, iBroker, Alor).
- Click on the Trade button in the trading panel.
- In the order panel, select the DOM tab - Order book.
- The DOM will open for the asset selected on the chart.
- If the data is not displayed, the symbol on the chart is not traded through the selected broker.
Basic parts of the DOM interface
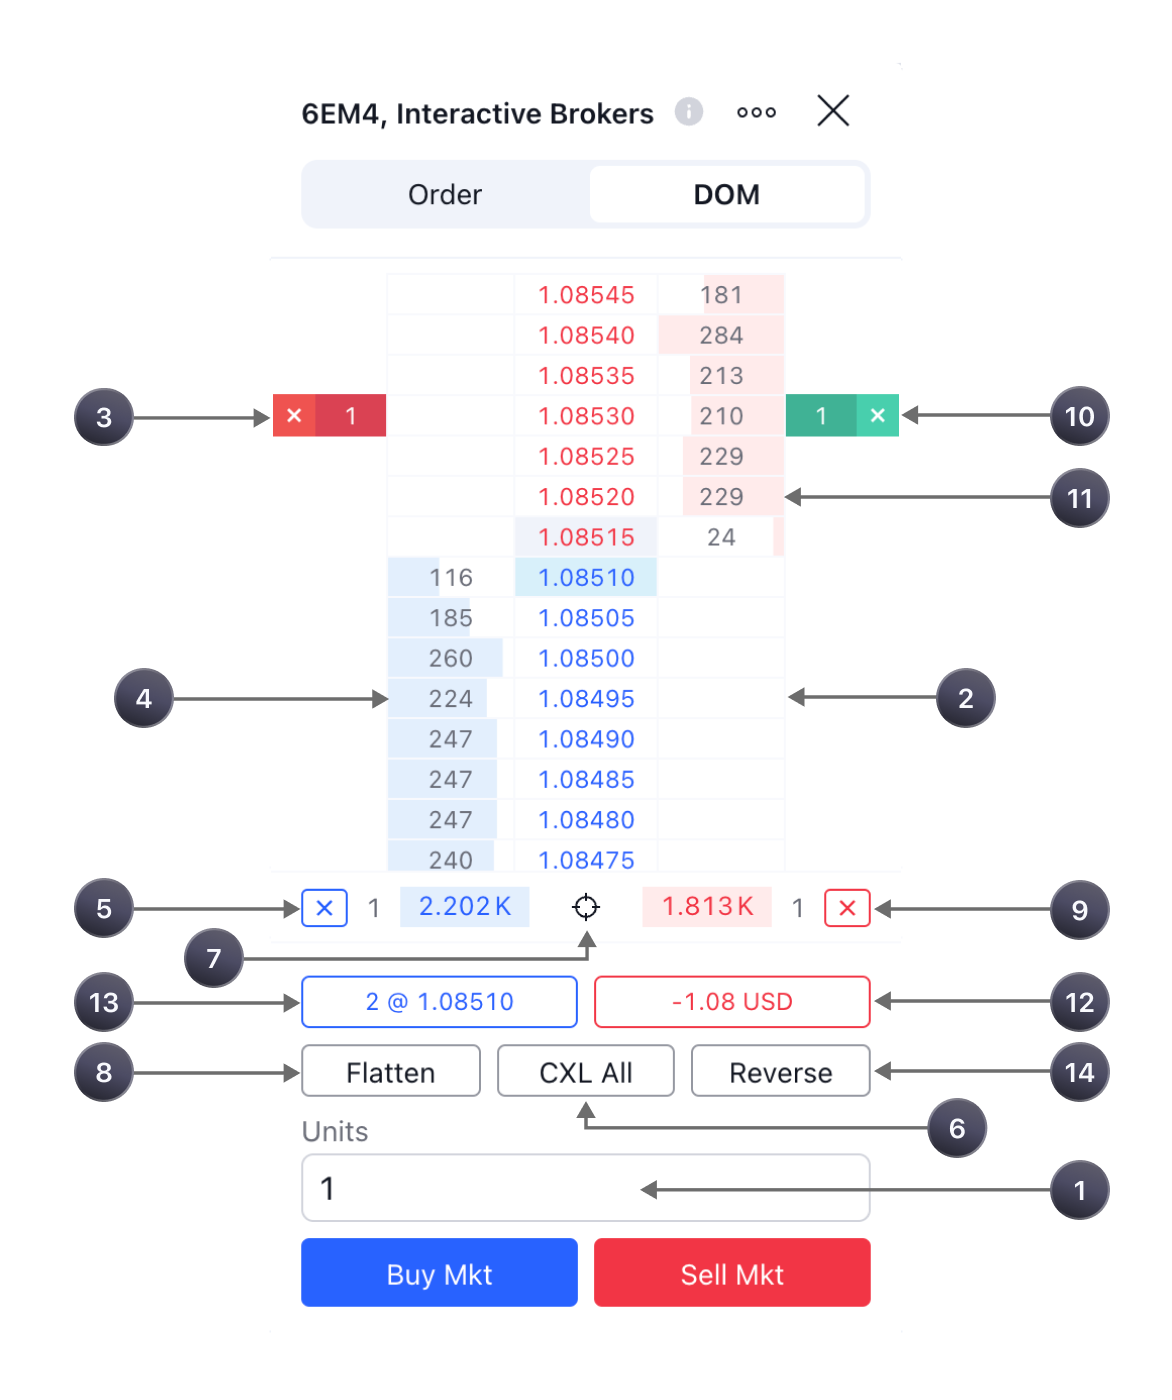
[1] — the Quantity field shows how many securities will be purchased or sold when placing an order.
[2] — cells for placing orders. When clicked commonly, a limit order is placed in them; when clicked while holding ctrl, a stop order is placed.
[3], [10] — placed orders.
Bids [4] / Asks [11] - the volume of orders available on the market.
[5], [9] - buttons for canceling all limit or stop orders placed on the current instrument.
[6] — button for canceling all orders on the current instrument.
[7] - centering button.
[8] - closing a position.
[12] — profit/loss for all open positions. You can change the display setting by clicking on this element to money, pips, or percentage.
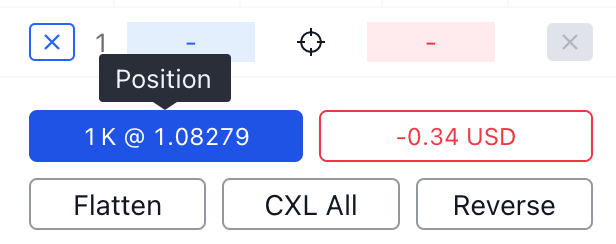
[13] — the size of all open positions.
[14] — position reversal.
What data is used for the DOM
The broker sends the data.
However, the data in the DOM and on the chart may differ slightly since different data sources are used.
Data is displayed in static mode. This means that the price series is fixed, while the price itself moves between these values, above or below the designated range. To apply centering at the current price, you need to click on the centering button [7].
Placing and changing orders
To place a market order, simply click the Buy Mkt or Sell Mkt button. The number in the Quantity field indicates how many securities will be purchased or sold. You indicate this at the bottom of the DOM window [1].
You can submit bids at specific prices. To buy - click on the cell with the price you need in the left column and sell in the right column.
If you want to place a limit order, simply click on the box next to the desired price. If you're going to place a stop order, hold down the Ctrl button on your keyboard and click on the desired cell.
Another way to place an order is to right-click on the cell next to the price you are interested in. After this, a window will open in which you can select the type of the order you need:

A confirmation dialog pops up by default. You can disable it in the settings.

How to change an order
1. Click on the placed order in the order book [3], [10]. A window will open in which you can change the parameters you need... After that, click Modify order.

2. Drag your order to a different price level. The same dialog box will open.

Label colors and their meaning
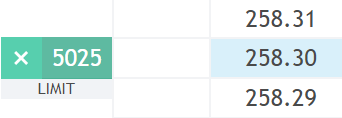
Active "Limit Buy" and "Limit Sell" orders are green.
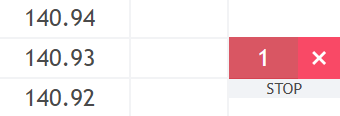
Active "Stop Buy" and "Stop Sell" orders are highlighted in red.
The active orders "StopLimit Buy" and "StopLimit Sell" are yellow. The limit level of such orders is dull, and the stop level is brighter.

Cancellation of orders
To cancel only one order, click on the cross next to its label to cancel only one order.
To cancel all purchase orders, click on the cross under the blue purchase column on the left [5].
To cancel all sales orders, click the cross under the red sales column on the right [9].
To cancel all orders, click the CXL ALL button at the bottom of the DOM window [6].
How to track and manage open positions
If you have open positions on the selected asset (buy or sell), the total size of these positions [13] will be shown as a number at the bottom of the DOM.
If you are in a long position (buy), the field will be blue, and if you are in a short position (sell), it will be red.
Long position (you believe the price will rise)
Short position (you believe the price will fall)

To close or reverse a position, use the Flatten [8] or Reverse [14] buttons at the bottom of the DOM.