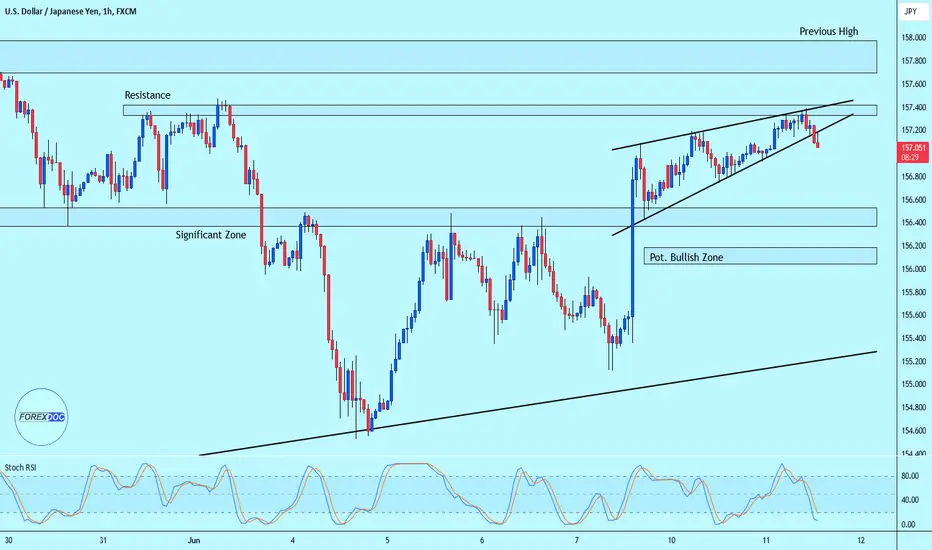
USD/JPY Bearish Move ?Price reached previous resistance zone and we can see bearish wedge formation. Price broke our wedge pattern and it is possible to see bearish move.
USDJPY trade ideas
USDJPY BEARThis is a bear set-up there is a higher start but looking for two targets. I will update later

USDJPY: 800+ Pips Buying Opportunity! Swing Trading Dear Traders,
Hope you are doing great, price of USDJPY remain tricky. Previously, we had anticipated that price will drop heavily, however, due to weak Japanese yen price remain bullish as it was before. We still currently in a correction zone, where we can expect price to drop slightly lower to our area of entry and then we can see a strong buyers liquidity kicking in the market.
*If you like the idea then please like, comment and follow us which will encourage us to bring you more educational ideas like this**
Team Setupsfx_

How Do Dovish and Hawkish Monetary Policies Affect Markets?How Do Dovish and Hawkish Monetary Policies Affect Markets?
In the intricate dance of global finance, central banks play a leading role, their policies echoing through markets and economies. The terms "dovish" and "hawkish" encapsulate their strategies towards interest rates and money supply, each with profound implications for currency values and investor strategies.
This FXOpen article explores how these stances offer valuable insights for traders in understanding the forex market’s movements and the broader economic landscape.
Understanding Dovish vs Hawkish
In the world of economics, central banks use monetary policy to navigate between stimulating growth and controlling inflation. This delicate balance is often characterised by two primary stances: dovish and hawkish. Understanding these policies is crucial for traders, as they significantly influence domestic economic conditions and the forex market.
Dovish Meaning
Central banks take a dovish monetary policy stance, aiming to stimulate the domestic economy. By lowering interest rates or keeping them low, central banks make borrowing cheaper, encouraging both businesses and consumers to take loans, invest, and spend. This increase in spending can lead to economic growth, but there's a catch: if the money supply increases too rapidly, it might outpace the economy's growth potential, leading to inflation.
In terms of unemployment, dovish policies can lead to job creation as businesses expand. Credit conditions become more lenient, fostering an environment ripe for economic activity.
Hawkish Meaning
Conversely, a hawkish stance aims to temper inflation and stabilise the economy when it shows signs of overheating. By raising interest rates, central banks make borrowing more expensive, which can cool down excessive spending and investment. This tightening of credit conditions is intended to prevent inflation from rising too high, too quickly.
While higher interest rates can attract foreign investment due to the promise of higher returns, leading to an appreciation of the domestic currency in the forex market, they can also dampen economic growth and increase unemployment rates as financing becomes costlier for businesses. Likewise, a stronger currency can affect exports by making them more expensive for foreign buyers, which is a critical consideration for traders analysing trade-heavy economies.
Capital Flows and the Forex Market
The interplay between these monetary policies and capital flows is a critical aspect for forex traders.
All else being equal, dovish policies, while boosting local economies, can lead to capital outflows as investors search for higher yields, causing the domestic currency to depreciate against its counterparts. However, a dovish policy can increase the attractiveness of investing in local stock markets due to cheaper borrowing costs.
On the other hand, hawkish policies attract foreign capital, appreciating the domestic currency, but potentially at the cost of slowing domestic economic growth.
Hawks and Doves: The Balance
The interplay between hawks and doves in central banking shapes the forex markets in profound ways. Traders meticulously analyse statements and policy directions from central banks and policymakers to gauge future price movements, which can be complemented by a wealth of trading tools in FXOpen’s free TickTrader platform.
A shift from a dovish to a hawkish stance (or vice versa) can lead to swift and significant currency movements as markets reposition based on the anticipated impact on interest rates and economic growth. For instance, even the mere expectation of a shift towards a more hawkish policy can strengthen a country’s currency as traders anticipate higher future returns.
Monetary Policy : Dovish
Effect
Low interest rates are expected to boost economic growth:
- Low rates encourage consumers and businesses to borrow (credits/loans)
- Cheap borrowing encourages consumers and businesses to invest and spend more
- Expanded businesses lead to rising employment
Risks:
- High inflation if the money supply increases too rapidly
- Capital outflow and weak domestic currency due to lower returns for investors
Monetary Policy : Hawkish
Effect
High interest rates are used to control an overheating economy:
- High interest rates lead to a reduction in borrowing
- Expensive borrowing leads to lower spending and investment, which causes lower prices and potentially lower inflation
- Higher rates lead to larger foreign investments due to higher returns, thus, stronger domestic currency
Risks:
- Slowing domestic economic growth due to reduced spending and investment
- Higher unemployment due to expensive borrowing for businesses and, therefore, inability to expand
Case Studies: USD/JPY Post-Pandemic
The USD/JPY currency pair witnessed a remarkable, bullish run post-COVID-19 pandemic, significantly influenced by diverging inflationary trends and monetary policy responses in the United States and Japan. This period underscored the profound impact of interest rate differentials on forex markets.
In the United States, a rapid acceleration of inflation was observed, with core inflation YoY increasing from 1.6% in March 2021 to an alarming 6.5% by March 2022. This inflationary surge compelled the Federal Reserve to initiate a series of aggressive rate hikes beginning in March 2022, escalating the benchmark interest rate from 0.25% to 0.5%. By July 2023, the US interest rate had surged to 5.5%, a clear indication of the Fed's commitment to quelling inflationary pressures.
Japan's economic scenario depicted a starkly different picture. The same inflation metric in Japan rose modestly from -0.3% to 0.8% over the same timeframe. The Bank of Japan (BoJ) continued its long-standing policy of negative interest rates, aiming to stimulate economic growth and combat deflationary risks.
This stark contrast in monetary policy trajectories between the two economies created a significant interest rate differential, fueling a strong bullish momentum in the USD/JPY pair. From March 1st 2022, when the Fed commenced its hiking campaign, the USD/JPY rose sharply from an opening of 115.084 to a peak of 151.943 in October 2022.
This movement was primarily driven by the growing attractiveness of the dollar as US interest rates rose, offering higher returns to investors compared to the yen, which remained anchored by Japan's negative interest rate policy.
How to Trade Based on Monetary Policy
Using monetary policy to formulate trading ideas involves gauging central banks’ actions and their implications for the wider currency market. Traders who grasp the nuances of these policies can position themselves to take advantage of expected movements in the forex market. Here’s a focused approach to trading based on monetary policy decisions:
1. Following Central Bank Announcements and Meetings
Central banks like the Federal Reserve, European Central Bank, and Bank of Japan regularly hold meetings to discuss monetary policy. The outcomes of these meetings, including interest rate decisions and policy statements, can significantly affect currency markets as they rapidly incorporate this new information. Traders mark these events on their calendars and prepare for increased volatility during and after announcements.
2. Analysing Policy Statements for Future Directions
Central bank policy statements provide insights into the bank's view of the economy and its future policy direction. Phrases indicating concerns about inflation might suggest a hawkish stance, potentially leading to rate hikes. Conversely, mentions of economic risks could indicate a dovish tilt, with possible rate cuts. Understanding these subtleties can give traders clues about future currency movements.
3. Monitoring Economic Indicators
Economic indicators like inflation rates, employment data, and GDP growth are closely watched by central banks and can influence their monetary policy decisions. Traders analyse these indicators to anticipate central banks' actions. For example, rising inflation above the central bank target might prompt a central bank to adopt a hawkish stance, potentially strengthening the currency.
4. Understanding Interest Rate Differentials
Interest rate differentials between countries are a fundamental driver of currency movements. Currencies from countries with higher interest rates often attract more investment, leading to appreciation. Traders can use this knowledge to trade currency pairs, expecting appreciation in currencies from countries likely to raise rates and maintain higher rates compared to their trading partners.
5. Considering the Global Economic Context
Monetary policy does not operate in a vacuum. Global economic conditions, geopolitical events, and market sentiment can all influence the effectiveness and impact of central bank actions. Traders must consider these factors, understanding that unexpected global events can quickly alter the expected effects of monetary policy decisions.
Caveats to Hawkish and Dovish Monetary Policy
While dovish and hawkish monetary policies wield significant influence over economic landscapes and forex markets, they come with nuances that traders and policymakers must navigate.
A dovish stance, though effective for stimulating economic growth, can lead to unintended consequences like asset bubbles due to prolonged low interest rates, making economies vulnerable to inflation spikes. If not carefully managed, this environment might erode purchasing power and destabilise financial markets.
Conversely, hawkish policies, designed to curb inflation by raising interest rates, might slow economic growth excessively or lead to higher unemployment rates. Such outcomes can strain consumer spending and investment, potentially tipping an economy into recession if overapplied.
Moreover, the global interconnectedness of markets means that a policy shift in a major economy can have ripple effects, impacting emerging market currencies and potentially leading to capital flight from countries with lower interest rates. Traders must consider these broader implications, as central banks' shifts between dovish and hawkish stances can lead to volatility and unpredictability in currency values.
The Bottom Line
The interplay between dovish and hawkish monetary policies not only shapes the global economic narrative but also creates pivotal moments for forex traders. By meticulously analysing these stances, traders can navigate the forex market with greater acumen, anticipating shifts that could affect currency values.
For those looking to leverage these insights into actionable strategies, opening an FXOpen account offers a gateway to applying this knowledge in the real-world arena of forex trading.
FAQs
What Is Dovish vs Hawkish?
Dovish and hawkish are terms used to describe the monetary policy stance of central banks. A dovish policy focuses on stimulating economic growth by lowering interest rates and increasing the money supply, potentially leading to a weaker currency. Conversely, a hawkish policy aims to control inflation by raising interest rates and reducing the money supply, typically resulting in a stronger currency. These stances significantly influence currency values, affecting forex trading strategies.
What Does Hawkish and Dovish Mean in the Forex Market?
In the forex market, hawkish and dovish policies influence currency pairs' direction. A central bank's hawkish stance can lead to currency appreciation due to higher interest rates attracting foreign capital. On the other hand, a dovish stance might cause currency depreciation as lower interest rates decrease the currency's yield, prompting investors to seek higher returns elsewhere. Traders closely monitor these policy shifts to anticipate market movements.
This article represents the opinion of the Companies operating under the FXOpen brand only. It is not to be construed as an offer, solicitation, or recommendation with respect to products and services provided by the Companies operating under the FXOpen brand, nor is it to be considered financial advice.

usdjpyafter the massive drop in price, i want to see price to trade back to the area of interest,
once the price give me entry criteria, i will look for short and hold the trade for about two dayss.

USDJPY SELL | Idea Trading AnalysisUSDJPY is moving in an ascending channel, move to the resistance level and We expect a decline in the channel after testing the current level.
Hello Traders, here is the full analysis.
I think we can soon see more fall from this range! GOOD LUCK! Great SELL opportunity USDJPY
I still did my best and this is the most likely count for me at the moment.
-------------------
Traders, if you liked this idea or if you have your own opinion about it, write in the comments. I will be glad 🤝

Bearish Deep Gartley Pattern w BOJ DecisionFor those who favor counter-trend trades or believe in a potential BOJ intervention, the Bearish Deep Gartley Pattern on the 1-hourly chart is worth your attention.
1-Hourly Chart:
- Key Level: This pattern provides an excellent risk-reward ratio for shorting opportunities.
Reminder:
- Don’t overtrade.
- Always conduct your own analysis and avoid blindly following others.
What's your trade plan for USDJPY? Comment down below and share your insights!
Happy trading!

USD/JPY Presents New Reversal Opportunity at 157.390The USD/JPY pair, having reached the target of our previous analysis, is now presenting another trading opportunity around the 157.390 level. This level is showing potential for a new reversal.
Market Dynamics
Current Setup: The price is forming an inversion swing pattern (fractal), indicating a possible downward push.
Technical Indicators: The swing pattern at 157.390 suggests a potential shift in momentum, making it an attractive level for a reversal trade.
Trading Strategy
Given the current setup and following the movements of other pairs against the USD, we are considering a short scalping position. Key considerations include:
Inversion Swing Pattern: The fractal pattern forming at the 157.390 level signals a possible bearish reversal.
Short Scalping Position: The technical setup suggests a potential push down, making it a suitable scenario for a short-term scalping trade.
In conclusion the USD/JPY pair is showing a new reversal opportunity at 157.390, with the formation of an inversion swing pattern suggesting a potential downward move. Traders may consider a short scalping position based on this technical setup, looking to capitalize on the anticipated bearish impulse.

Lingrid | USDJPY Potential long TRADE from SUPPORT levelThe daily chart is displaying a strong uptrend, with the FX:USDJPY having recently broken and closed above a previously tested level. This significant breach was marked by a large bullish candle, indicating that the level has gained importance. The price action had earlier formed a triangle pattern, which was eventually broken through. On the daily chart, the market is now approaching a strong resistance zone where we witnessed a massive sell-off. I'm anticipating a retest of the support level and confirmation of buying momentum before making any further moves. My target is resistance zone at 158.450
Traders, if you liked this idea or if you have your own opinion about it, write in the comments. I will be glad 👩💻

Potential bearish reversal?USD/JPY is rising towards the pivot which acts as a pullback resistance and could reverse to the 1st support.
Pivot: 157.96
1st Support: 155.78
1st Resistance: 158.93
Risk Warning:
Trading Forex and CFDs carries a high level of risk to your capital and you should only trade with money you can afford to lose. Trading Forex and CFDs may not be suitable for all investors, so please ensure that you fully understand the risks involved and seek independent advice if necessary.
Disclaimer:
The above opinions given constitute general market commentary, and do not constitute the opinion or advice of IC Markets or any form of personal or investment advice.
Any opinions, news, research, analyses, prices, other information, or links to third-party sites contained on this website are provided on an "as-is" basis, are intended only to be informative, is not an advice nor a recommendation, nor research, or a record of our trading prices, or an offer of, or solicitation for a transaction in any financial instrument and thus should not be treated as such. The information provided does not involve any specific investment objectives, financial situation and needs of any specific person who may receive it. Please be aware, that past performance is not a reliable indicator of future performance and/or results. Past Performance or Forward-looking scenarios based upon the reasonable beliefs of the third-party provider are not a guarantee of future performance. Actual results may differ materially from those anticipated in forward-looking or past performance statements. IC Markets makes no representation or warranty and assumes no liability as to the accuracy or completeness of the information provided, nor any loss arising from any investment based on a recommendation, forecast or any information supplied by any third-party.

USD/JPY continues to maintain its short-term upward trendThe USD/JPY exchange rate has seen a significant increase compared to the previous trading session. Early this morning, the currency pair surpassed the 110.50 JPY per USD mark.
The USD/JPY rate is influenced by monetary policy information from the Federal Reserve (Fed) and the Bank of Japan (BoJ).
USD/JPY may continue to maintain an upward trend in the short term, but investors should be cautious of market volatility and practice effective risk management.

USDJPY - Expect retracement !!Hello traders!
‼️ This is my perspective on USDJPY.
Technical analysis: Here we are in a bullish market structure from 4H timeframe perspective, so I look only for long position. For now I expect price to make a retracement to fill that huge imbalance lower and then to reject from bullish order block
Fundamental news: Tomorrow (GMT+3) we have important news in USA, we will see results of CPI and Interest Rate. As well on Friday we will have news regarding Interest Rate in Japan. Pay attention to the result in order to validate the analysis.
Like, comment and subscribe to be in touch with my content!

USDJPY (Bullish Overall)USD/JPY 4-Hour Chart Analysis
Trend Analysis:
- The 4-hour chart shows an overall uptrend, with higher highs and higher lows indicating bullish momentum.
- Recently, the price has experienced some volatility but remains above key support levels.
Support and Resistance Levels:
- Immediate Support Level: 156.00, which could act as a short-term support if the price pulls back.
- Next Support Level: 154.50, a significant support level that has been tested previously.
- Immediate Resistance Level: 157.30, which is close to the current price and could act as a barrier to upward movement.
- Next Resistance Level: 158.00, a key resistance level that aligns with recent highs.
Technical Indicators:
- The recent candlestick patterns suggest some consolidation, but the overall trend remains bullish.
- There are no immediate signs of a reversal, indicating that the bullish momentum may continue.
Direction Preference:
Given the current uptrend and the lack of reversal signals, the preferred direction for USD/JPY in the short term is bullish. The price is likely to continue moving higher towards the resistance levels of 157.30 and potentially 158.00.
Conclusion:
The USD/JPY 4-hour chart indicates a bullish trend with continued upward momentum. It is advisable to consider long positions, targeting the resistance levels at 157.30 and 158.00. Monitor for any signs of consolidation or pullback, but as of now, the bullish trend remains the preferred direction.

Bearish on USDJPYThe recent price action shows a push towards a resistance zone, indicating potential exhaustion or a reversal point.
The shaded area marks a significant resistance zone around the 157.700 - 158.000 levels. This zone has been tested multiple times and has held as a strong supply area.
Immediate support can be identified around the 156.500 level, which aligns with previous swing lows and a possible demand zone.
A stronger support level is around 155.500, a psychological round number that has acted as a base for previous price reversals.
Below the 156.500 support level, there may be sell-side liquidity, where sell stops from long positions could be resting.
The resistance area (157.700 - 158.000) is a supply zone, where significant selling interest could push the price lower.
A notable fair value gap (FVG) or imbalance between 155.500 and 157.000 from previous price movements suggests potential areas for price retracement.
Entry: Consider entering a short position around the 157.700 - 158.000 resistance zone.
Stop Loss: Place the stop loss slightly above the resistance zone, around 158.200, to account for potential liquidity grabs.
Take Profit: Aim to take profits around the immediate support at 156.500 and a more extended target around the 155.500 level, aligning with the demand zone and previous lows.

Market Analysis: USD/JPY Continues To RiseMarket Analysis: USD/JPY Continues To Rise
USD/JPY is rising and might take out the 157.40 resistance.
Important Takeaways for USD/JPY Analysis Today
- USD/JPY climbed higher above the 155.25 and 156.25 levels.
- There is a connecting bullish trend line forming with support at 156.85 on the hourly chart at FXOpen.
USD/JPY Technical Analysis
On the hourly chart of USD/JPY at FXOpen, the pair started a strong increase from the 155.25 zone. The US Dollar gained bullish momentum above 156.25 against the Japanese Yen.
It even cleared the 50-hour simple moving average and 157.00. The current price action above the 157.00 level is positive. A high is formed at 157.40 and the pair might continue to rise. Immediate resistance on the USD/JPY chart is near 157.40.
The first major resistance is near 157.80. If there is a close above the 157.80 level and the RSI moves above 60, the pair could rise toward 158.50. The next major resistance is near 159.20, above which the pair could test 160.00 in the coming days.
On the downside, the first major support is near the 23.6% Fib retracement level of the upward move from the 155.11 swing low to the 157.40 high at 156.85. There is also a connecting bullish trend line forming with support at 156.85.
The next major support is visible near the 50% Fib retracement level of the upward move from the 155.11 swing low to the 157.40 high at 156.25. If there is a close below 156.25, the pair could decline steadily.
In the stated case, the pair might drop toward the 155.25 support zone. The next stop for the bears may perhaps be near the 154.60 region.
Trade over 50 forex markets 24 hours a day with FXOpen. Take advantage of low commissions, deep liquidity, and spreads from 0.0 pips. Open your FXOpen account now or learn more about trading forex with FXOpen.
This article represents the opinion of the Companies operating under the FXOpen brand only. It is not to be construed as an offer, solicitation, or recommendation with respect to products and services provided by the Companies operating under the FXOpen brand, nor is it to be considered financial advice.

DeGRAM | USDJPY rebound from the accumulation zoneUSDJPY is moving near the upper boundary of the accumulation zone.
The accumulation zone has already triggered three times as a rebound point.
The chart has successfully consolidated above the dynamic support.
We expect the rebound to continue.
-------------------
Share your opinion in the comments and support the idea with like. Thanks for your support!

Potential move up for next week on UJSetting up a new high on Friday , the trend might stay bullish for next week. Marking up 3 different levels on the 1H with potential formation of a "double bottoms" before continuation.
I will be trading on the 5M but these levels might become significant areas of resistance/support therefore can change the trend and momentum.
Trust The Hustle
Views expressed are my own ;)

USDJPY: Maintain the daily purchase of the dayHello everyone. Today, we’re looking at the USD/JPY pair, which is trading around the 157.50 level. The US Dollar is currently gaining an advantage over the Japanese Yen following the Bank of Japan's decision to maintain its existing policy settings.
Short-term chart analysis indicates a bullish trend as this currency pair consolidates within an ascending channel pattern, suggesting the potential for continued upward movement.

USDJPY"The USD/JPY has formed a positive pattern, activated by the breakout, with an upward trajectory targeting the 163.4 level."

USD-JPY Long From Rising Support! Buy!
Hello,Traders!
USD-JPY is trading along
The rising support line
And we are already seeing
A bullish rebound after the
Retest of the support so we
Are locally bullish biased
And we will be expecting
A further move up
Buy!
Like, comment and subscribe to help us grow!
Check out other forecasts below too!

usdjpy downtrend it is happening ..... due to my previous analysis i realized usdjpy just bounces back on that resistance line

Bullish USDJPYi am seeing resistance and a consolidated area, we’re looking for that pullback, once we get that confirmation we’re going in. REMEMBER risk management. I personally do a strat called #SETANDFORGET

USDJPY SHORT Position to 155.565I see price double top on the 30 Minute time frame at a resistance level. it looks like it made a lower high, signaling a reversal to the downside within that level that I have marked up. I marked the level on the h4 and scaled in the 30M to come up with this analysis. Comment below and let me your thoughts on this.
