DAX: Aiming its 1M MA50 at 21,000.DAX remains bearish on its 1D technical outlook (RSI = 36.976, MACD = -170.928, ADX = 18.868) despite today's strong gains as it remains on a 2 month decline since the August ATH. The 17 year pattern may be a Channel Up bu having traded within its Top range (Fibonacci 0.786-1.0) for the majority of
Where the world does markets
Join 100 million traders and investors taking the future into their own hands.
Get started for free$0 forever, no credit card needed

Supercharged
Supercharts

PYTH 2x Setup Loading! Breaks the Three-Year DowntrendBINANCE:PYTHUSDT Weekly Time Frame
PYTH (1W) spent more than two years in a descending channel after the 2024 high near 1.16, and it bottomed near 0.0295 in 2026. Price has since rallied sharply, breaking above the upper channel trendline and reclaiming the lower red anchored VWAP, which acted as
Is a Neutral Bias Becoming More Evident in WTI?Price action around WTI crude oil has begun to reflect an increasingly evident neutral bias in the short term. This can be seen in the performance of the last three trading sessions, where the commodity has gained only around 1.4%, without developing the type of directional move that would suggest a
6J Yen Futures Eye Key Support as BOJ and Fed Paths DivergeYen Caught Between a Hawkish Fed, a Cautious BOJ and Tokyo’s Warnings
Yen futures are consolidating after a volatile stretch driven by policy, fiscal and energy headlines. On Sep 2, Bank of Japan board member Hajime Takata said the central bank should raise rates nimbly rather than follow a fixed
The Complicated Art of Keeping It SimpleIf you've been trading for a while, you may recognise the feeling that some of your clearest decisions have also felt surprisingly effortless. The market made sense, there was conviction behind the reasoning and little temptation to keep searching for another piece of information before making a dec
Nasdaq at a record: the buy is the retest, not the highThe daily trend is up: 11 of 11 of our trend measures agree, and the 4H chart has made higher highs and higher lows since 16 Sep.
The zone: 31,143 to 31,282. It is the old breakout level, and buyers defended it on 7 Oct.
Plan
Trigger: a retest of 31,282 that holds. Price is near 31,385, so this is
$NPC 1D - Limit Long setup (mid Nov TP)With GTA 6 ready to be released on 19 November, which is a highly anticipated event overall, it makes sense to bet on its related meme.
With Non Playable Characters (NPC's) gaining more and more AI mechanics, this exact narrative makes sense to capture everyone's attention as one of the ways how th
BNB: Bullish Until Key Support BreaksGETTEX:BNB Update
#BNB is still holding inside the broader rising channel on the 4H timeframe, which remains important for the short-term structure. As long as price continues to respect this channel and stays within the current range, the broader bullish momentum remains intact.
On the daily tim
The AI Boom Is Running on Borrowed Money. Should Traders Worry?The AI boom has found a new investor: The bond market.
The artificial intelligence boom has produced extraordinary revenue, record-breaking stock rallies and a seemingly endless appetite for Nvidia NASDAQ:NVDA chips. Now comes the bill.
SpaceX NASDAQ:SPCX is seeking $40 billion in financing
STX Building a Triangle Squeeze, Watching for BreakoutNASDAQ:STX continues to coil inside a multi-month symmetrical triangle, with higher lows pressing against a descending resistance trendline.
Price is currently trading just below the key breakout level near 866. The longer this compression persists, the greater the potential expansion move once pr
See all editors' picks ideas
RedK Indicator Amplifier (RedK i-Amp)🟩 What is RedK i-Amp?
-------------------------------
RedK i-Amp is not an indicator in itself - it's a "wrapper" utility that "amplifies" another "source" indicator by improving its visual and alerting capabilities.
RedK i-Amp hooks to another indicator's plot and enables the addition of the fol
TASC 2026.10 A Low-Risk ETF-Trading Strategy█ OVERVIEW
This script implements concepts from a short-term ETF investment strategy outlined by Markos Katsanos in the article "Selecting Strong ETFs While Avoiding Sharp Overbought Reversals" from the October 2026 edition of TASC Traders' Tips . The strategy analyzes Katsanos' custom relative s
Buyers & Sellers Profile + Dynamic S/R (Zeiierman)█ Overview
Buyers & Sellers Profile + Dynamic S/R (Zeiierman) is a volume-profile and market-structure indicator designed to combine a large rolling Buyers/Sellers Volume Profile with dynamically generated support and resistance levels.
Instead of treating the volume profile and swing structure
Vol-Control Fund PositioningThe investors who sell because nothing happened
In 2017 the American stock market was so calm that a whole class of institutional portfolios held more equities than their own capital, simply because the rules they follow told them to. Reconstructed with the model behind this indicator, their estim
RedK Multi-Modal TrailingStop (RedK MMTStop)█ RedK MMTStop - Release Notes
Introduction & background
RedK MMTStop is a Multi-Modal Trailing Stop indicator - Let's quickly explore the "trailing stop" concept first as a refresher - then explain what a multi-modal trailing stop indicator does.
A "Trailing Stop" is what helps traders avoi
Trend Target Ribbon [BOSWaves]Trend Target Ribbon - ALMA Conviction Trend Detection with Integrated Structure-Based Position Planning and R-Multiple Target Tracking
Overview
Trend Target Ribbon is an ALMA-based trend identification system that combines slope-normalized momentum confirmation with standard deviation band
Wyckoff [theUltimator5]This indicator was designed to be a comprehensive, intuitive, overly engineered algorithm that plots Wyckoff accumulation and distribution patterns on the chart as they arise. It shows the current status of the regime on a side panel, while also overlaying the accumulation or distribution schematic
XeL OnlineRecursionXeL OnlineRecursion is a Pine Script library for online and streaming statistical estimation on continuous numerical and financial data.
The library is designed around recursive statistical populations whose retained state is updated observation by observation. Most recursive components use consta
Dual-Phase Reversal by DGTDual-Phase Reversal • Exhaustion, Pivots & Pressure
Dual-Phase Reversal (DPR) is a two-phase market exhaustion framework that tracks directional momentum through Momentum Exhaustion and Terminal Exhaustion . It combines sequential price conditions, Momentum Shift initiation, phase qualificatio
Zeiierman Trend Pressure (Zeiierman)█ Overview
Zeiierman Trend Pressure (Zeiierman) is a multi-layer trend pressure and exhaustion oscillator designed to visualize short-term momentum, persistent trend structure, directional pressure, and exhaustion states within a normalized 0 to -100 range.
Instead of relying on a single osci
See all indicators and strategies
Community trends
AAPL: Ascending-Wedge-Formation, Bearish Pullback Possible!Hello Community,
welcome to my new analysis of AAPL on the weekly timeframe perspective. In my recent analysis, I have spotted crucial signs within AAPL that could lead to a major market turn. Especially in the current market phase, a bearish breakdown could lead to further bearish triggers and ac
Tesla Reclaims Key Resistance — Can Buyers Extend the Recovery?Market Structure
Tesla has shifted back into a constructive bullish structure on the 4-hour chart after recovering sharply from its late-July low. Price continues to print higher highs and higher lows, with buyers successfully reclaiming previous resistance. The latest advance has pushed Tesla bac
The Complicated Art of Keeping It SimpleIf you've been trading for a while, you may recognise the feeling that some of your clearest decisions have also felt surprisingly effortless. The market made sense, there was conviction behind the reasoning and little temptation to keep searching for another piece of information before making a dec
Netflix - This stock will double soon!🎥Netflix ( NASDAQ:NFLX ) is retesting massive support:
🔎Analysis summary:
Netflix is right now retesting the major previous all time high created back in 2021. And at the same time, Netflix is also testing its two decade long channel support trendline. If Netflix creates confirmation, the fol
NVDA (NVIDIA Corporation) Analysis on 1-Hour Timeframe - NASDAQ.Option 1 (Professional):
NVDA Bearish Breakdown? | BOSS Confirmed | My 3 Targets - $228, $218, $208 | NVDA Analysis
Option 2 (Catchy):
NVIDIA (NVDA) Ready To CRASH? | Break Of Structure (BOSS) | 3 Big Targets Inside
Option 3 (Short):
NVDA Stock Analysis Today | Range Breakdown | Target $208
### D
MICRON Dotcom vs A.I Bubble Comparison. Case for $400 correctionMicron Technology (MU) is showing strong signs of a strong correction half-way through its A.I. Bubble structure. This is what the stock experienced in the middle of the Dotcom Bubble after peaking in September 1995 and correcting aggressively to its 1M MA50 (blue trend-line) and bottoming right bel
$ONDS still on sidelines waiting for setups with attractive r/rOndas CEO Eric Brock says:
“Both ULTRA and IonStrike have captured strategically significant orders and are advancing through key customer validation milestones, which we believe can open substantially larger markets.”
Real orders and customer validation could be important catalysts for Ondas as i
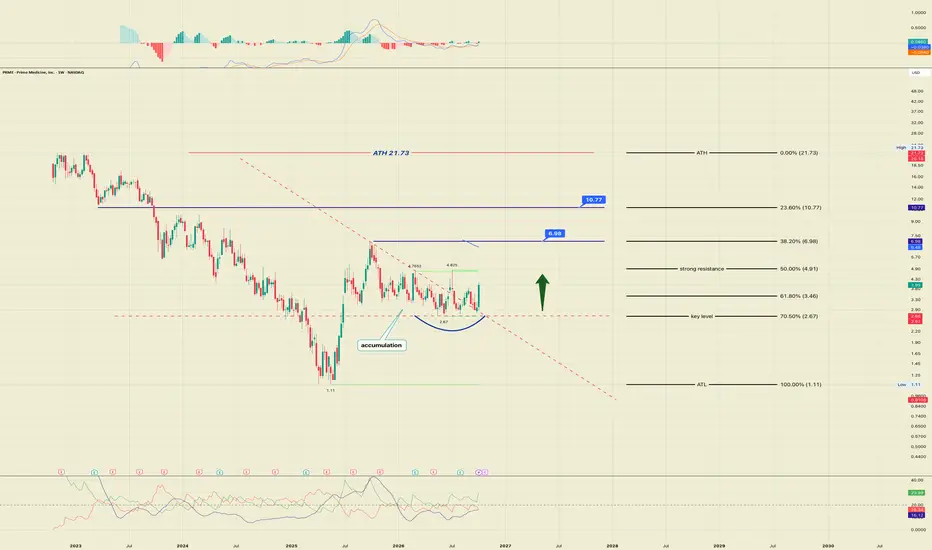
PRME 1W: FDA Opens the Gates. DNA Accumulation CompleteThe long-term chart of NASDAQ:PRME reveals a classic institutional accumulation stage and deliberate position building by a large market participant, which has been developing since November 2025 within a rounding bottom structure. The key support level at 2.67 has been tested four times since May
Rubrik Expands Project Hourglass as Selling Costs DeclineRubrik (RBRK:NYSE) is increasingly leaning on partners to support its artificial intelligence security push, expanding a key alliance as its sales and marketing expenses continue to fall as a share of revenue. On October 9, at its GSI Summit in Goa, India, the company announced an expansion of Proje
See all stocks ideas
Oct 12
AEHRAehr Test Systems
Actual
—
Estimate
—
Oct 12
CHRNChronoScale Holdings Corporation
Actual
—
Estimate
−0.09
USD
Oct 12
VFSVinFast Auto Ltd.
Actual
—
Estimate
−0.27
USD
Oct 12
PGRProgressive Corporation (The)
Actual
—
Estimate
4.30
USD
Oct 12
NRIXNurix Therapeutics, Inc.
Actual
—
Estimate
−0.60
USD
Oct 12
CMTLComtech Telecommunications Corp.
Actual
—
Estimate
−0.51
USD
Oct 13
DPZDomino's Pizza Inc
Actual
—
Estimate
4.36
USD
Oct 13
JNJJohnson & Johnson
Actual
—
Estimate
2.50
USD
See more events
Community trends
BTCUSD 1D | SMC Market Structure Liquidity & Trendline AnalysisBTCUSD 1D | SMC Market Structure, Liquidity & Trendline Analysis
Detailed Educational Description — Candle-by-Candle Analysis
This BTCUSD 1D chart focuses on Smart Money Concepts (SMC), market structure, liquidity zones, support and resistance, Fair Value Gaps (FVG), Order Blocks, and trendline b
Bitcoin Double Top Breakdown — Is $77.5K the Next Target?Bitcoin ( BINANCE:BTCUSDT ) has declined more than 5% over the past three days and lost the Support Zone($81,950-$82,960).
BTC has started to react from the 50_SMA(Daily), but several macro and market risks continue to increase short-term bearish pressure.
Can buyers defend the psychological $80,0
B T C : ($82 600 Buy Stop)BTCUSD — LONG SIGNAL
Entry: 82,000–82,400
Stop Loss: 81,200
TP1: 83,500
TP2: 84,500
TP3: 85,500–86,000
Risk/Reward: roughly 1:2.5–1:4 depending on entry.
Analysis
BTC has completed a strong corrective decline into the Wave (4) area, where the chart shows a defined demand/support zone. The projecte
BTC Rebuilds Bullish Momentum as Price Climbs Away From 80,400Hello traders! Here’s my technical outlook based on the current BTCUSDT (4H) chart structure. BTCUSDT previously broke higher from a descending structure and formed a strong upward Trend Line. Price then entered a range near the Seller Zone, tested support, and bounced. Currently, BTCUSDT is trading
Funding Rates and PositioningFunding rates are often reduced to a simple rule: high positive funding means too many longs, while deeply negative funding means too many shorts. That interpretation misses what funding is actually designed to do.
Perpetual futures do not expire like traditional futures contracts, so exchanges nee
BNBUSDT | Rising Trendline Under Pressure at 800 Resistance🔹 BNBUSDT is consolidating below the major resistance zone around 795–800 after a strong recovery from lower levels. Price remains inside a broader rising structure, while the ascending trendline continues to provide support beneath the recent consolidation. The repeated reactions around 775–785 sug
BTCUSD: Higher Prices Still Struggle to Attract CapitalBitcoin has bounced sharply from the 80,500 area, but the strength of the rebound is not what matters most to me. The bigger question is how the market responds as Bitcoin is repriced at higher levels. So far, buying interest has not shown the conviction needed to turn this recovery into a genuine r
BITCOIN: THIS Underlying Pattern is Guiding the NEXT Market!Hello Community,
welcome to my new analysis of BITCOIN from a broader timeframe perspective. BITCOIN is following an interesting pattern that I recently spotted. This pattern is particularly interesting because BITCOIN has already managed to bounce off the $60,000 level, confirming it as a pivotal
BTCUSD 1H | Bearish Price Action SetupBitcoin is moving inside a descending channel, showing a clear bearish structure.
🔍 Key Resistance Zone: 83,997
🎯 Downside Target: 80,311
📊 Current Price: Around 82,741
Technical Analysis:
Price is approaching the upper trendline of the descending channel, where resistance could trigger another be
BNB: Bullish Until Key Support BreaksGETTEX:BNB Update
#BNB is still holding inside the broader rising channel on the 4H timeframe, which remains important for the short-term structure. As long as price continues to respect this channel and stays within the current range, the broader bullish momentum remains intact.
On the daily tim
See all crypto ideas
XAUUSD — GOLD KEY DECISION ZONE | BULLISH REACTION OR BEARISH XAUUSD — GOLD PRICE ACTION EDUCATION | EVERY CANDLE HAS A REASON
Gold is approaching a major decision zone. The chart shows a broader bearish structure, repeated selling pressure, liquidity reactions, and a possible bullish recovery from the support area. To understand what Gold may do next, we mus
XAU/USD 4H Trendline Breakout (09.10.2026)XAU/USD has confirmed a clean trendline breakout on the 4H timeframe following a sharp rejection from the 4,086.00 to 4,117.00 support zone.
Bullish momentum is building as buyers regain control above the falling channel structure. The market faced strong rejection from recent lows, clearing the pa
GOLD Price Update – Clean & Clear ExplanationGold is currently trading around 4185 after a strong recovery from the 4100 support area and price is now approaching a critical resistance zone between 4195 – 4215, where bullish momentum could face renewed selling pressure.
Fundamentally, US dollar strength, Treasury yield movements, and changing
GOLD - A short squeeze in 4220 could trigger a decline IC:XAUUSD remains within a medium-term bearish trend. However, the market is recovering locally as part of a liquidity-hunting phase. The key focus is on the current trading range.
The dollar is stagnating as traders take profits ahead of the long weekend in the U.S. and await next week’s key
THE KOG REPORT - UpdateEnd of day update from us here at KOG:
Price went up into our hotspot, Asia gave us a nice short trade and the bias level held us up. Now we have broken upside but this ranging is getting frustrating and now we're late session. For that reason, I'd say we'll re-visit this tomorrow and look for a
GOLD Bearish Pressure Resistance Rejection DownsideGold is currently showing a recovery within a broader bearish market structure. After a strong downside move, price has rebounded toward the 4,190 / 4,225 resistance zone.
Recent market weakness has been linked to a stronger US Dollar, rising US Treasury yields, and concerns that the Federal Reserv
GOLD: Bearish Structure Still Intact, Key Resistance Ahead#GOLD Update
Gold is bouncing from $4,065, but in my view this is still a counter-trend correction within the broader bearish structure.
The interesting part is that the descending trendline and the Fixed Range Volume Profile POC are coming together around the $4,140–$4,170 area. This makes that z
Descending Structure Favors Another Liquidity Sweep LowerXAUUSD — Intraday Sell-the-Rally Scalp
Gold remains inside a short-term descending structure, while the current recovery is approaching a technically important resistance cluster.
The preferred approach is not to chase price lower, but to wait for a retracement into the 4151.4–4163.1 area and loo
XAUUSD H1: Breakout Confirmed, But Is Gold Ready for 4,220?Gold has finally broken free from the descending structure that controlled price action over the past several sessions. After sweeping liquidity below 4,100, buyers gradually rebuilt momentum, formed a bullish Change of Character (CHOCH), and pushed price through the upper boundary of the bearish ch
GOLD 4H: A Potential Trendline Breakout Toward Higher Liquidity.
XAUUSD is approaching a technically significant area after an extended bearish move on the 4-hour timeframe. Recent price action suggests that buyers are attempting to regain short-term momentum, with price moving toward the descending trendline and the nearby buy-side liquidity zone around 4,219.
See all futures ideas
EURUSD – H4 – Descending Trendline Breakout & Bullish Reversal SEURUSD – H4 – Descending Trendline Breakout & Bullish Reversal Setup
EURUSD is currently trading around 1.12250 and showing signs of recovery after a sustained bearish move. Price is testing the descending trendline, while the 1.11402–1.11650 support zone remains a key area to watch.
📌 Support Zon
USDCHF is Nearing a Strong Support!Hey Traders, in today's trading session we are monitoring USDCHF for a buying opportunity around 0.82600 zone, USDCHF is trading in an uptrend and currently is in a correction phase in which it is approaching the trend at 0.82600 support and resistance area.
Trade safe, Joe.
EUR/USD - H1 Trendline breakout#EURUSD #Forex #TradingView #TechnicalAnalysis
The Euro is regaining ground against the Greenback as a slight pullback in US 10-year Treasury yields eases immediate dollar demand.
While elevated crude oil prices keep global inflation expectations high, market expectations of ECB rate stability com
USDJPY Bullish Continuation Setup**USDJPY is holding above a rising trendline, showing a bullish structure despite the recent pullback. A rebound from the trendline support could push price toward the **158.22 target**, with a stronger bullish continuation potentially reaching the major **158.90–159.00 resistance zone**.
**Targets:*
AUDUSD 1H: Bearish Rejection at Resistance
AUDUSD is approaching a key resistance zone around **0.6988–0.6990**, where sellers may step in and push the price lower. The market has recovered from the support area near 0.6910, but the recent price action shows hesitation below resistance, suggesting a possible bearish rejection.
If the pric
EURUSD Faces Another Sell Off Risk Beneath the 1.1220 CeilingHello traders! Here’s my technical outlook based on the current EURUSD (1H) chart structure. EURUSD previously started to decline under the Trend Line and tested the Seller Zone multiple times. Price then formed a Fake Breakout and was rejected, continuing the bearish structure. Currently, EURUSD is
EURUSD: Potential Slide To 1.1150 After Its Latest ReversalHello everyone, here is my breakdown of the current EURUSD setup.
Market Analysis
EURUSD previously traded inside a range and triangle structure before breaking higher. Price then entered a downward channel, tested the Resistance Zone near 1.1280, and was rejected, confirming the bearish shift.
NZDUSD Tests Multi-Month DemandNZDUSD Tests Multi-Month Demand
I have posted this analysis before. The price is still holding strong in that area, indicating a very strong support zone. The chances of further gains are increasing, given that the current zone is proving strong.
Structure Analysis (Daily)
The price has been i
EURUSD | Bullish Breakout & Bullish Continuation Setup
### Fundamental View
EURUSD is rebounding from its recent weekly low as a softer US dollar and a pullback in US Treasury yields provide short-term support for the euro. Declining oil prices may also ease inflation concerns and reduce pressure on global bond yields. However, ongoing European fisca
GBP/USD Falling Wedge Breakout (09.10.2026) GBP/USD has confirmed a clean breakout from a well-defined falling wedge pattern on the 2-hour timeframe.
A strong candle close above the descending trendline and the Ichimoku cloud near 1.3235 confirms the bullish breakout. This clears the path toward the first resistance at 1.3350, followed by
See all forex ideas
Trade directly on Supercharts through our supported, fully-verified, and user-reviewed brokers.