PYTH: buybacks strong, waiting for a pullbackPYTH powers a market-data oracle where more than 120 exchanges and trading firms publish prices directly. The business is growing fast: annual recurring revenue reached 11.5 million dollars in September, up 86% quarter over quarter. On October 8, a standing DAO rule took effect that sends 100% of th
Where the world does markets
Join 100 million traders and investors taking the future into their own hands.
Get started for free$0 forever, no credit card needed

Supercharged
Supercharts

USD/CHF Rises as SNB Stays Dovish and U.S. Dollar FirmsUSD/CHF stayed firm on Monday as geopolitical stress and another jump in energy prices drove demand back toward the U.S. Dollar. Brent pushed above $106 after fresh attacks in Saudi Arabia, keeping the inflation story alive ahead of Wednesday’s U.S. CPI report. Markets see only about a 19% chance of
Long-term value unlock in RNIRNI is trading very far below NAV and we think that there is a longer-term opportunity for a value unlock here.
The stock sold off on the back of a disposal and the large amount of cash on the balance sheet. The market is waiting to see what the company intends to do with all that cash, and thus fa
ADOBE (Photoshop & Illustrator): A New Technical Era (2026)I named the title "ADOBE (Photoshop & Illustrator): A New Technical Era (2026)" because we have multiple confluences on multiple timeframes occurring synonymously.
Monthly:
Long-term diagonal TL from 1987, hit multiple times. Now the price has given signs of life at that TL in 2026.
A-B-C complet
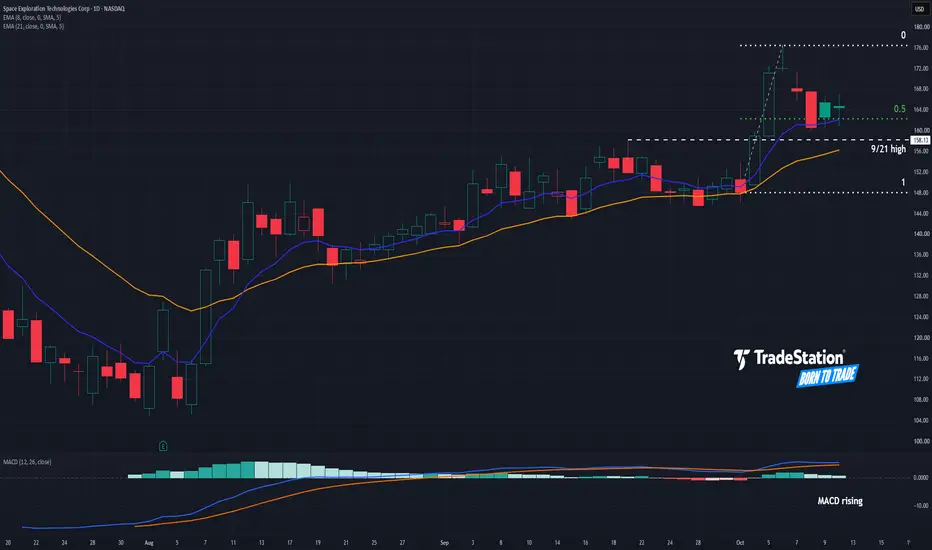
SpaceX Steadies After SurgeSpace Exploration Technologies jumped earlier this month, and some traders could think the ascent will continue.
The first pattern on today’s chart is the October 1-6 rally. The space-launch company has pulled back to hold a 50 percent retracement of that move, which may confirm the direction of th
USDCAD H1 | Bullish Bounce Off Key SupportMomentum: Bullish
Price is currently above the ichimoku cloud.
Buy entry: 1.42291
- Overlap support
- 78.6% Fib retracement
- 100% Fib projection
Stop Loss: 1.42019
- Swing low support
Take Profit: 1.42851
- Swing high resistance
High Risk Investment Warning
Stratos Markets Limited (fxcm.com/uk
Ethereum: Rising Channel Keeps $3,000 in FocusEthereum price action continues to trade within a local ascending channel, maintaining a sequence of higher lows as buyers defend key support. The channel's lower boundary, situated around $2,400, remains an important technical level, with recent price action respecting this region and preserving th
Elliott Wave Analysis – XAUUSD | October 13, 2026
1. Daily Timeframe (D1)
D1 momentum has reached the overbought zone and is now preparing to reverse downward. If today's daily candle continues to maintain bearish momentum, the market could enter a corrective decline lasting approximately 3–5 trading days.
At this stage, as we expect wave (Y) t
Gold Hints at Quiet Accumulation as Bulls Seek DipsGold made a mild attempt to reverse its trend and break above its bearish trendline, although falling volumes suggest the move lacks strong bullish conviction for now. However, the sharp rejection of $4,100 ahead of the bounce suggests quiet accumulation may be underway, with bulls potentially seeki
Copper at a Record, but the Tariff Trade Is FadingOn 9 September 2026, front-month LME copper set an all-time high of $14,940 per tonne. COMEX Copper Futures followed with its own record of $6.9285 per lb on 22 September. Both have since pulled back.
The force behind the rally was not a shortage. Traders were pricing in an expected US tariff on i
See all editors' picks ideas
RedK Indicator Amplifier (RedK i-Amp)🟩 What is RedK i-Amp?
-------------------------------
RedK i-Amp is not an indicator in itself - it's a "wrapper" utility that "amplifies" another "source" indicator by improving its visual and alerting capabilities.
RedK i-Amp hooks to another indicator's plot and enables the addition of the fol
TASC 2026.10 A Low-Risk ETF-Trading Strategy█ OVERVIEW
This script implements concepts from a short-term ETF investment strategy outlined by Markos Katsanos in the article "Selecting Strong ETFs While Avoiding Sharp Overbought Reversals" from the October 2026 edition of TASC Traders' Tips . The strategy analyzes Katsanos' custom relative s
Buyers & Sellers Profile + Dynamic S/R (Zeiierman)█ Overview
Buyers & Sellers Profile + Dynamic S/R (Zeiierman) is a volume-profile and market-structure indicator designed to combine a large rolling Buyers/Sellers Volume Profile with dynamically generated support and resistance levels.
Instead of treating the volume profile and swing structure
Vol-Control Fund PositioningThe investors who sell because nothing happened
In 2017 the American stock market was so calm that a whole class of institutional portfolios held more equities than their own capital, simply because the rules they follow told them to. Reconstructed with the model behind this indicator, their estim
RedK Multi-Modal TrailingStop (RedK MMTStop)█ RedK MMTStop - Release Notes
Introduction & background
RedK MMTStop is a Multi-Modal Trailing Stop indicator - Let's quickly explore the "trailing stop" concept first as a refresher - then explain what a multi-modal trailing stop indicator does.
A "Trailing Stop" is what helps traders avoi
Trend Target Ribbon [BOSWaves]Trend Target Ribbon - ALMA Conviction Trend Detection with Integrated Structure-Based Position Planning and R-Multiple Target Tracking
Overview
Trend Target Ribbon is an ALMA-based trend identification system that combines slope-normalized momentum confirmation with standard deviation band
Wyckoff [theUltimator5]This indicator was designed to be a comprehensive, intuitive, overly engineered algorithm that plots Wyckoff accumulation and distribution patterns on the chart as they arise. It shows the current status of the regime on a side panel, while also overlaying the accumulation or distribution schematic
XeL OnlineRecursionXeL OnlineRecursion is a Pine Script library for online and streaming statistical estimation on continuous numerical and financial data.
The library is designed around recursive statistical populations whose retained state is updated observation by observation. Most recursive components use consta
Dual-Phase Reversal by DGTDual-Phase Reversal • Exhaustion, Pivots & Pressure
Dual-Phase Reversal (DPR) is a two-phase market exhaustion framework that tracks directional momentum through Momentum Exhaustion and Terminal Exhaustion . It combines sequential price conditions, Momentum Shift initiation, phase qualificatio
Zeiierman Trend Pressure (Zeiierman)█ Overview
Zeiierman Trend Pressure (Zeiierman) is a multi-layer trend pressure and exhaustion oscillator designed to visualize short-term momentum, persistent trend structure, directional pressure, and exhaustion states within a normalized 0 to -100 range.
Instead of relying on a single osci
See all indicators and strategies
Community trends
SPCX Breaks Trendline: Is 146 Liquidity Next?🔹 SPCX experienced a strong bullish rally toward the 176.00 region before facing a sharp rejection, shifting the short-term market structure toward bearish pressure. Price subsequently broke below the rising trendline and lost the 164.00 resistance area, suggesting that buyers are struggling to rega
NUCL - $5 Support Could Trigger the Next Bullish Wave!Eagle Nuclear Energy NASDAQ:NUCL is approaching an important technical area, with price currently retesting a major support zone that has historically attracted buying interest.
After a previous bullish impulse , NUCL has entered a correction phase, bringing price back toward the $5 round numbe
$MU: Head and Shoulders Formation Puts Demand Zone in FocusMicron NASDAQ:MU is showing signs of weakness on the daily chart, and for now, I’m leaning toward further downside before considering a long entry.
Price appears to be forming a head and shoulders pattern, with Fibonacci retracement levels adding another layer of confluence. The area around the 0
SpaceX - Please look at this break and retest!🚀SpaceX ( NASDAQ:SPCX ) is now back to major support:
🔎Analysis summary:
Just a couple of days ago, SpaceX broke some major daily resistance towards the upside. And with the recent short term correction, SpaceX is now retesting this previous breakout area. If SpaceX creates bullish confirmati
TSM can drop to $400 if the 1D MA50 doesn't hold.Taiwan Semiconductor Manufacturing (TSM) hit today its 1D MA50 (blue trend-line) for the first time in 1 month (since September 16). With the long-term pattern being a Channel Up, if the price closes a 1D candle below the 1D MA50, the pattern may seek its bottom.
The 1D MA200 (orange trend-line) is
$COIN headed to new lows?Coin has been consolidating in a sideways since February of this year. With the recent rejection of the highs (forming a structural lower high), it seems that NASDAQ:COIN is set to break down to new lows.
I think it's possible that we see all the way down to $100 support or lower if we get a brea
Breakout & Confirmed Re-TestFFIV is displaying one of the cleanest and strongest bullish trends in the current market environment. The structural price action here is exceptionally well-defined.
The Technical Picture:
The stock recently cleared a major multi-month resistance wall around $460. Following that breakout, the price
MSFT too overbought at 540$ rebuy support not all time high!!!Possible triple top at all tiem high'S weekly... not bullish to me, not good to buy long term here or even for swing trading. Too overbought far from ema's, and there's gap's to the downside so better risk ratio to just buy lower than chase the all time high's... 460-420$ would be a good time to buy
Shoe Station Group ($SHOE): debt-free retailer at half of bookMICROCAP OF THE DAY: Shoe Station Group ( NASDAQ:SHOE )
Shrinking shoe chain, or a debt-free retailer selling for half its book value?
What they do: Shoe Station Group, called Shoe Carnival until June 2026, runs 421 family footwear stores in 35 states and Puerto Rico under the Shoe Carnival and Sh
JPM | Is JPMorgan’s Growth Story Losing Steam?JPMorganChase grew revenue 8% year over year to $50.2 billion, but missed analyst expectations by $300 million. Net income rose 6% to $15.3 billion, while adjusted EPS came in at $5.75, falling $0.19 short of forecasts after excluding $658 million in investment securities losses. Net interest income
See all stocks ideas
Today
PNCPNC Financial Services Group, Inc. (The)
Actual
4.97
USD
Estimate
4.91
USD
Today
BNYThe Bank of New York Mellon Corporation
Actual
2.34
USD
Estimate
2.27
USD
Today
FHNFirst Horizon Corporation
Actual
—
Estimate
0.52
USD
Today
USBU.S. Bancorp
Actual
1.34
USD
Estimate
1.32
USD
Today
CMCCommercial Metals Company
Actual
2.09
USD
Estimate
1.95
USD
Today
MRSHMarsh
Actual
2.03
USD
Estimate
1.97
USD
Today
SCHWCharles Schwab Corporation (The)
Actual
—
Estimate
1.65
USD
Today
WAFDWaFd, Inc.
Actual
—
Estimate
0.84
USD
See more events
Community trends
Bitcoin Huge Drop to 69k! Then New All Time High.Bitcoin is probably starting a massive 20% correction - my target is 69k. Why? I have many reasons.
The first reason is that from a technical point of view, Bitcoin just finished an impulse wave 12345 from the bottom of the bull market. Elliott Wave theory tells us that after an impulse wave we sho
BTCUSD — EMA 50 + RSI 14 | Professional Market Analysis & Key BTCUSD — EMA 50 + RSI 14 | PROFESSIONAL PRICE ACTION ANALYSIS
Bitcoin is showing a battle between buyers and sellers around the current price area of 84,217 shown on the reference chart. Price has recovered from lower levels, but it is approaching an important resistance and Fair Value Gap (FVG) zo
BTCUSDT 4H: ICT Liquidity Sweep, MSS & Order Block AnalysisBTCUSDT 4H | Advanced ICT & Smart Money Concepts Analysis
1. Market Overview
This analysis examines Bitcoin (BTCUSDT) on the 4-hour timeframe using Inner Circle Trader (ICT) concepts and Smart Money Concepts (SMC). The objective is to understand liquidity distribution, market structure, potential
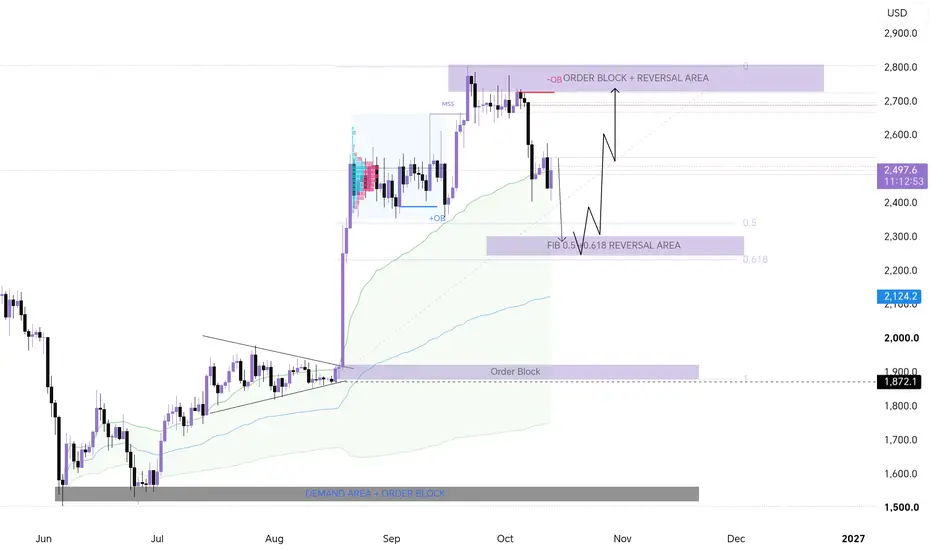
ETHUSD ICT Order Block, Fibonacci OTE & Market Structure This analysis presents a potential bullish continuation setup using ICT market structure, order blocks, Fibonacci retracement, and dynamic support. Price previously formed a consolidation pattern before breaking upward with strong bullish displacement. After reaching the upper resistance region, the
TradeCityPro | Bitcoin Daily Analysis #380👋 Welcome to TradeCityPro!
Let’s take a look at Bitcoin. The US CPI data was released today, and it could have a significant long-term impact on the market.
💡 The CPI is one of the key indicators of US inflation. This month’s reading came in higher than expected, meaning inflation in the US was hig
Bitcoin Tests the 50-Day SMA — Is $85K the Next Target?Bitcoin ( BINANCE:BTCUSDT ) is currently approaching the Support Zone($82,950-$81,950), the Cumulative Long Liquidation Leverage($82,630-$81,770), and the key trading level of $82,620.
The 50_SMA(Daily) also remains an important support, and Bitcoin has not yet confirmed a breakdown below it.
Can
BTCUSDT: Stabilizes Above Support With 85,300 as the Next TestHello everyone, here is my breakdown of the current BTCUSDT setup.
Market Analysis
BTCUSDT previously traded inside a downward channel before breaking higher and forming a range. Price then entered an upward channel, tested the Support Zone near 82,300, and bounced, showing signs of buyers defend
BTCUSDT 4H Market Analysis Supply ,Demand Zones, Liquidity Sweep
BTCUSDT 4H Market Analysis | Supply & Demand, Liquidity Sweep, FVG and Bearish Scenario
Overview
This BTCUSDT 4-hour chart presents a Smart Money Concepts (SMC)-based market analysis using price action, supply and demand zones, Fair Value Gaps (FVGs), liquidity levels, trendline support, and key
Repeated Supply Rejections Put Bitcoin’s Local Support in FocusHello traders! Here’s my technical outlook based on the current BTCUSDT (1H) chart structure. BTCUSDT previously turned around from the highs and formed a descending structure under the Resistance Line. Price then tested the Seller Zone multiple times with breakouts and was rejected. Currently, BTCU
BITCOIN - Consolidation Amid a Bull Market CycleBINANCE:BTCUSDT.P maintains its medium-term bullish trend while forming a local countertrend correction, potentially setting the stage for consolidation ahead of a possible medium-term distribution phase
Various analytical services point to temporary market stagnation, while also indicating fr
See all crypto ideas
GOLD - A countertrend correction ahead of the CPI. Downtrend...IC:XAUUSD is confirming another bearish structure within its medium-term downtrend. However, inflation data is due to be released, and the market could develop a corrective move.
The dollar has paused its correction, while Treasury yields have stabilized. Traders are taking profits following g
XAUUSD 4H | SMC Market Structure Liquidity & Trendline EducationXAUUSD 4H — Professional Candle-by-Candle Education
This chart explains how Smart Money Concepts (SMC), liquidity, market structure, FVGs, Order Blocks and the bearish trendline work together. Every candle should be read according to its location, previous structure and reaction from important zone
XAU/USD | Can This Demand Zone Trigger The Next Rally?Before anything else, this is a completely new Gold analysis , so make sure you open the chart in full quality and carefully study all the important levels I've marked!
By analyzing the #Gold chart on the 4H timeframe, we can see that after dropping toward $4066, Gold started a strong recovery tow
XAUUSD 1D | Institutional Market Structure & Liquidity FrameworkXAUUSD 1D | Institutional Market Structure & Liquidity Framework — Educational Analysis
Oil Trendline Context: Oil is approaching its trendline support, where a confirmed bullish reaction could support a recovery in energy prices
Gold Connection: If Oil rebounds while geopolitical risk and market
XAU/USD | Still stuck between the FVGs, further drop incoming?By analyzing the 4H chart of Gold we can see that it is still stuck in between the 2 FVGs, currently being traded at around 4190 level.
Gold dropped inside the 4H FVG but then bounced back up, reaching the psychological resistance 4200 level but it was rejected by it. Currently, I expect Gold to re
GOLD Consolidation Bearish continues CPI NEWS in FocusGold is showing continued bearish pressure with price trading below a descending trendline and struggling to regain key resistance zones.
📰 Fundamental Update — US CPI TODAY
The major event is the upcoming US Consumer Price Index (CPI) report for September. Markets are waiting for fresh inflation
Gold 30Min Engaged ( Bullish & Bearish Reversal Detected )
HANZO MARKET LIQUIDITY REPORT
USOIL
Timeframe: 30min (Volume Basis)
Scale: Higher Timeframe Context / Deep Volume analysis
━━━━━━━━━━━━━━━━━━━━━━
Market Observation
This analysis is focusing on structural behavior, liquidity zones, Volume analysis
and key areas of interest within the current range
XAUUSD | CPI Liquidity Hunt & Bearish Continuation Setup# XAUUSD | CPI Liquidity Hunt & Bearish Continuation Setup
### Fundamental View
Gold remains sensitive to US inflation data, Treasury yields, dollar movements, and escalating Middle East tensions. A stronger-than-expected CPI report could revive expectations for tighter Federal Reserve policy, pot
GOLD 1H CHART – MARKET ROUTE MAP UPDATEHey Everyone,
As anticipated, following the break below 4189, price has now moved deeper into our full swing range support, delivering our usual 50 pip bounces along the way.
🟢 FULL SWING SUPPORT – REACTION EXPECTED
Price has now reached a strong technical swing support area around 4076, where we
OILHello Traders! 👋
What are your thoughts on CRUDE OIL?
WTI crude oil continues to trade within an ascending channel on the daily timeframe. Following the recent correction, price has reached the lower boundary of the channel, overlapping with the highlighted support zone around $87.50–$91.50, where
See all futures ideas
GBPUSDGBPUSD is showing strong bearish momentum on the daily timeframe after rejection from the 1.3500–1.3550 resistance area. Price has broken below the key 1.3200 structure, indicating continued selling pressure.
KEY RESISTANCE ZONES
The 1.3200–1.3250 area is now a potential resistance zone. If price
EURUSD 4H | Bearish Trend, EMA 9/21 & Support Resistance EURUSD 4H Market Structure Analysis
EURUSD 4H Technical Analysis | Bearish Trend, EMA 9/21, BOS, CHoCH, Support & Resistance
Welcome to Market Education Academy 📊
This educational EURUSD 4-hour chart explains how to read market structure, understand bearish momentum, identify support and resista
USDCHF is Nearing a Strong Support Area!Hey Traders, in today's trading session we are monitoring USDCHF for a buying opportunity around 0.82800 zone, USDCHF is trading in an uptrend and currently is in a correction phase in which it is approaching the trend at 0.82800 support and resistance area.
Trade safe, Joe.
GBPUSD: Bearish Order Block — Drop to 1.3160?Hook :
FX:GBPUSD remains under bearish pressure on the 4H chart , with a potential short setup developing around the 1.3275–1.3296 bearish order block. If sellers defend this area, the next downside objective is 1.3160, near the lower support structure. 🔥
Market Context :
GBPUSD is trading aro
EURUSD: 1.1220 Rejection Puts Sellers Back in the SpotlightHello everyone, here is my breakdown of the current EURUSD setup.
Market Analysis
EURUSD previously traded inside an upward channel before breaking lower into a wedge structure. Price then tested the Resistance Zone near 1.1220 and was rejected, confirming the bearish shift.
Currently, EURUSD is
EURUSD Short: Bearish Structure Faces Its Next Test Near 1.1150Hello traders! Here’s my technical outlook based on the current EURUSD (1H) chart structure. EURUSD previously traded inside a range before breaking lower under the descending Trend Line and shifting into a clear bearish structure. Price then tested the Supply Zone near 1.1250 several times, where s
EURUSD 1H: Support Bounce Signals Potential Bullish RecoveryEURUSD 1H: Support Bounce Signals Potential Bullish Recovery
EURUSD is recovering from the 1.1155–1.1180 support area while approaching the descending trendline. A sustained breakout above trendline resistance could strengthen bullish momentum toward the marked resistance zones.
📈 Bullish Route
🎯
EURUSD - CONTRACTING TRIANGLE FORMATION
The pair is locked in a large 🔺 triangle, showing consistent lower highs and stable support. Current price action is coiling near the lower boundary, reflecting a bearish bias within this broader consolidation phase. Recent touches at support confirm a temporary floor for the structure.
Market pr
USD/CHF: Bullish Move from SupportThe 📈USDCHF pair appears bullish following the completion of a consolidation on a key intraday support level.
The formation of a bullish imbalance candle provides a strong indication of upward momentum.
I anticipate that the price will rise to reach at least the 0.8345 level.
EURUSD EURUSD is facing strong selling pressure after rejection from the upper resistance area and a breakdown below the descending trendline. Price action continues to form a bearish structure, keeping sellers in control while the pair remains below the 1.1200–1.1250 resistance zone.
The recent U.S. infl
See all forex ideas
Trade directly on Supercharts through our supported, fully-verified, and user-reviewed brokers.