How much of the drop did the bounce recover?A bounce looks bigger when you only measure it from the low. Put the drop back into the picture.
On this 15 minute NASDAQ:NVDA chart, price was around $175 before the selloff, reached the high $150s and bounced around $160. Use rounded levels to see the scale: a move from $175 to $158 lost $17. A
Where the world does markets
Join 100 million traders and investors taking the future into their own hands.
Get started for free$0 forever, no credit card needed

Supercharged
Supercharts

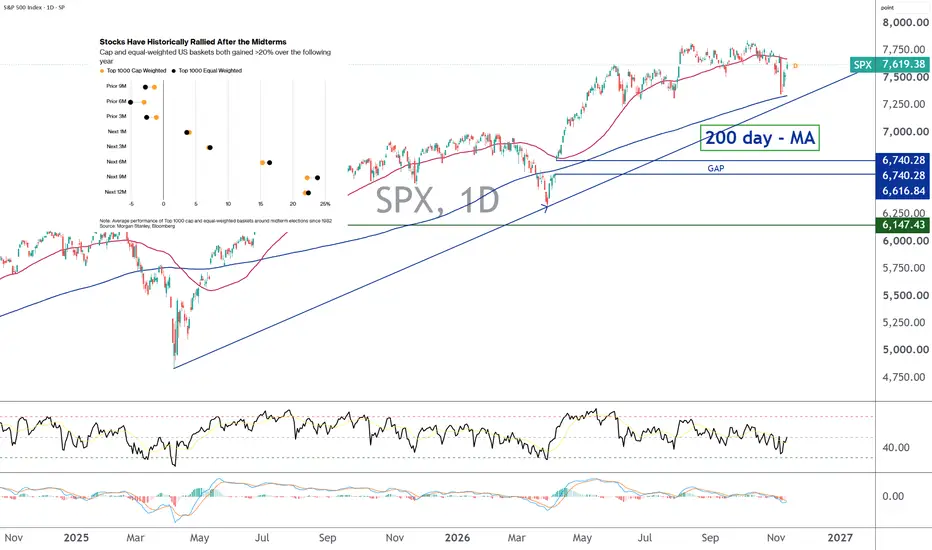
S&P 500, underlying bullish trend remains intactThe US stock market went through a short-term consolidation phase in October, amid profit-taking in the technology sector, and more particularly in semiconductors, which underwent a controlled retracement over six months, from June to early November, in the wake of the US midterm elections.
This co
Elliott Wave Analysis – XAUUSD | November 12, 2026
1. Daily Timeframe (D1)
Daily momentum is currently declining, suggesting that the ongoing bearish correction or sideways consolidation could continue for another 1–2 days.
XAUUSD has declined to fill the previous bullish Fair Value Gap (FVG) and is now approaching a bullish Order Block (OB) on
Bullish bounce at 50% Fib resistance?XAU/USD is falling to a support level, a pullback support that aligns with the 50% Fibonacci retracement and could bounce from here to our take profit.
Entry: 3,991.39
Why we like it:
There is a pullback support level that aligns with the 50% Fibonacci retracement.
Stop loss: 3,879.03
Why we like
Microsoft's Window of Opportunity (for OnlyBearFriends)A stalwart of what long term success can look like in global markets, NASDAQ:MSFT has increased shareholder value by 3500% (35X) since 2009; surviving shifts in technology, advancements in digital risk/threats and the changeover of many CEOs.
However, like all assets tradeable by humans (or bots
AAVE got Kraken and Avon news and no bid. I sell the retestKraken's parent Payward bought an undisclosed amount of AAVE on 5 Nov, and Aave Labs bought the Avon team on 6 Nov. AAVE flushed to 122.27 on the day of the Payward news, bounced to 131 and has not moved since. Good news and no bid. X is bullish only, all tokenization talk.
Trend: AAVE ran 85.02 (1
NVIDIA - Could Primary Wave 4 Shake Wall Street?The World's Leading Stock Could Bring Down the House
NVIDIA tagged the high time frame 2.618 level earlier back in May '26 and has been showing signs of weakness ever since. In my proposed count of impulsive waves, this area could likely mark primary yellow Wave 3, where we could expect a high time
Bitcoin to new lows from here $42-54k next, $10-20k afterThe title of the chart isn't meant to trigger people. I already know what the comments will be "tHeRe's No waY we CoulD EveR See $10k."
Alright, well let me explain the thinking of what's happening and then explain things from a technical perspective.
I think what's happening in the crypto market
DXY: Major Support Test at 102 - Bullish Rebound Ahead?Executive Summary & Market Context
The U.S. Dollar Index (DXY) is currently exhibiting a crucial structural retest following a sustained medium-term recovery phase. Price action has pulled back directly into a high-confluence support zone near the 102.00 psychological handle and previous resistance
SILVER: Is This the Bottom We've Been Waiting For?Silver just bounced after weeks of heavy selling. And this time, the weekly chart is starting to tell a different story.
I think there's a good chance the weekly bottom is already in.
But before getting too bullish, there's one level buyers still need to break.
📊 WEEKLY: Did We Just See the Bott
See all editors' picks ideas
RedK DualTF Volume-Accelerated CCI (RedK VA-CCI)🟩 RedK VA-CCI Release Notes
===========================
RedK VA-CCI is a modern take on the Commodity Channel Index (CCI) classic indicator.
RedK VA-CCI leverages the core CCI concept, and builds around it to provide traders with comprehensive insights, dual timeframe capabilities, and many other
Volume Profile Anatomies (D / B / P / Double Zone)You know how volume profiles all kind of look like blobs, and people talk about "D-shaped" and "P-shaped" profiles like everyone's supposed to just see it? This indicator does the squinting for you — it builds a real volume profile from the chart's bars, finds the POC and value area, then politely t
Higher Timeframe Trend Frontier (Zeiierman)█ Overview
Higher Timeframe Trend Frontier (Zeiierman) is an adaptive higher-timeframe indicator designed to visualize HTF opening levels, developing price structure, directional movement, and potential trapped buyers and sellers.
Unlike traditional HTF indicators that simply plot historical
PineTunnel█ OVERVIEW
PineTunnel is a Pine Script library that re-implements TradingView's
strategy.* broker emulator for indicator() scripts. It mirrors the full
strategy.* namespace one-to-one — 114 exports: 88 functions, 18
constants and 8 types — covering entries, brackets, trailing stops,
OCA groups,
Confluence Profile█ OVERVIEW
Confluence Profile is a tool for finding places where several independent technical factors point to a similar price level. It does not give buy or sell signals. Instead, it shows where Fibonacci levels, Order Blocks, Fair Value Gaps and volume nodes cluster on the chart, and how many of
Rolling Candle Profile with Buy/Sell Signals (Zeiierman)█ Overview
Rolling Candle Profile with Buy/Sell Signals (Zeiierman) is a dynamic price-pressure indicator that visualizes buying and selling dominance, directional pressure concentrations, and weak-pressure regions directly on the chart.
The indicator constructs a 12-layer Rolling Pressure Prof
Innovation Adaptive Kalman Filter Oscillator█ OVERVIEW
The Innovation Adaptive Kalman Filter (IAKF) is a modern implementation of the Kalman filter that uses its own prediction errors to detect abnormal measurements and adapt its measurement-noise estimate.
This indicator is an oscillator that adapts recent research in GPS and inertial nav
Market Matrix (Zeiierman)█ Overview
Market Matrix (Zeiierman) is a multi-timeframe market analysis dashboard that brings together price structure, trend, momentum, and market strength into six compact indicator panels.
Instead of switching between multiple indicators and timeframes, Market Matrix displays higher-timefr
RedK Indicator Amplifier (RedK i-Amp)🟩 What is RedK i-Amp?
-------------------------------
RedK i-Amp is not an indicator in itself - it's a "wrapper" utility that "amplifies" another "source" indicator by improving its visual and alerting capabilities.
RedK i-Amp hooks to another indicator's plot and enables the addition of the fol
TASC 2026.10 A Low-Risk ETF-Trading Strategy█ OVERVIEW
This script implements concepts from a short-term ETF investment strategy outlined by Markos Katsanos in the article "Selecting Strong ETFs While Avoiding Sharp Overbought Reversals" from the October 2026 edition of TASC Traders' Tips . The strategy analyzes Katsanos' custom relative s
See all indicators and strategies
Community trends
Nvidia −25% in 24 sessions: bounce to 196 or trap below 170?The board of NASDAQ:NVDA opened an independent investigation, with directors and outside counsel, into the conduct of CEO Jensen Huang, who acknowledged he had fallen short of his responsibilities in a personal matter. There is talk of a possible foreign-intelligence angle, which Beijing denies an
Netflix - Finally starting the +100% bullrun!🎥Netflix ( NASDAQ:NFLX ) is preparing a massive bullrun:
🔎Analysis summary:
For a couple of weeks in a row now, Netflix has just been trading at this clear support area. And while Netflix is creating some short term noise, the higher timeframe remains clearly bullish. Netflix just has to crea
COSTCO Approaching a 1.5-year Resistance. $1300 next if broken.Two months ago (September 10, see chart below), we published our long-term view on Costco (COST), giving a buy signal exactly on the September Low, with a 2-year Target of $1800:
On the more medium-term however, the price is about to test the Inner Higher Highs trend-line, which is the 1.5-year
BULL: The Anatomy of Accumulation. Where the Fall Ends?Technical analysis is not about finding magic indicators; it is about understanding market structure. On the 2-day chart, Webull is exhibiting a classic accumulation phase following a massive decline from historical highs. The market has repriced the asset, and smart money is methodically accumulati
NVIDIA Stock Drops 31% From Its Peak. Is $164 the Bottom?NVIDIA (NASDAQ: NVDA) has taken a beating over the past few weeks. Shares have fallen roughly 31% from their October peak of $243.37, breaking below the key $190 support level before hitting a 52-week low of $164.27.
Several factors have shaken investor confidence. Uncertainty following the U.S. mi
GOOGL | Protected Low Holds, Three Pools AboveThe higher-timeframe trend is still bullish. Price has simply been handed back to the level that built it.
━━━━━━━━━━━━━━━━━━━━
THE STRUCTURE
━━━━━━━━━━━━━━━━━━━━
The larger structure has been bullish through the whole of this chart: consecutive BOS to the upside, with the advance from Apr
AMD: IS THE REBOUND RUNNING INTO RESISTANCE?AMD has made a sharp recovery after its recent sell-off, but I’m watching whether buyers can push through the next resistance area or whether the bounce begins to fade.
On my 1-hour chart, price was around $526.09 when the screenshot was taken on November 10. My focus is the area near $538.61, wher
NVIDIA (NVDA) Bullish Again · New All-Time High Early 2027?Support confirmed! Bullish Again! A new All-Time High?
NVDA is a stock and it points higher. Then I am seeing similar things with Gold (XAU) and then also Bitcoin (BTC). All across comes the confirmation of support. All around this leads to a bullish wave. Everywhere this ends with higher prices an
PLTR: Correction Toward SupportAfter its third-quarter earnings release, Palantir’s fundamental outlook strengthened further. Revenue increased 96% year over year to $2.31 billion, while U.S. commercial revenue surged 148% to $984 million, surpassing U.S. government revenue for the first time. The company raised its full-year rev
NVDA Daily: Closed Inside Support, Two Paths From HereNVDA lost about 5% on the last daily candle and closed at 168.89, right inside the 166.5 – 170.9 support zone.
Zones on the daily chart:
• Support zone 166.5 – 170.9: price is sitting in it now.
• Upper reaction zone 192.2 – 198.3: the first zone above the current price.
• Trend-change level 217.9
See all stocks ideas
Community trends
BITCOIN'S MAKE-OR-BREAK ZONE BULLISH REVERSAL AHEAD? BITCOIN WEEKLY ANALYSIS | THE ROAD TO $105K OR A BREAKDOWN TO $58K?
What Is the Market Telling Us?
Bitcoin's weekly structure is approaching a critical decision zone. After an extended bullish expansion, the market has shifted into a corrective phase, creating a major battle between long-term bu
BTCUSDT Weekly Analysis | Bearish Outlook Key Support & Downside BTCUSDT – MEGA BEARISH WEEKLY ANALYSIS | WHY BITCOIN COULD DROP FURTHER | GLOBAL POLITICAL & ECONOMIC RISKS
BITCOIN (BTCUSDT) – WEEKLY TIMEFRAME
MARKET BIAS: BEARISH BELOW KEY RESISTANCE
Bitcoin is facing multiple technical and macroeconomic challenges. Our weekly analysis focuses on market str
BTCUSDT: An Expanding Wedge Puts the Next Move Up in FocusHello everyone, here is my breakdown of the current BTCUSDT setup.
Market Analysis
BTCUSDT previously traded inside a downward channel before entering an expanding wedge structure. Price then tested the Support Zone near 72,700 with a fake breakout and rebounded, showing signs of buyers defending
BTCUSDT Bitcoin is showing early signs of a possible bullish recovery after an extended bearish move within a descending channel. Recent price action indicates that buyers are attempting to defend the key demand zone around 73,500–74,000. The market has reacted positively from this area, suggesting that sel
Bitcoin’s Declining Structure Keeps the 72,300 Scenario RelevantHello traders! Here’s my technical outlook based on the current BTCUSDT (1H) chart structure. BTCUSDT previously formed a Rounding Top near the highs and started to decline under the Trend Line. Price then entered a descending structure and tested the Seller Zone with breakouts.Currently, BTCUSDT is
bitcoin at the turning point: bulls target $76,500 and $81,500Bitcoin is approaching a critical support zone around $72,000–$72,500, where a potential demand reaction could trigger a meaningful recovery. After an extended bearish move, price is showing signs of stabilization, creating an opportunity for buyers to regain control.
The 4H chart suggests that a r
BTCUSD H4 | Liquidity Sweep & Bearish Continuation SetupBTCUSD H4 | Liquidity Sweep & Bearish Continuation Setup
📊 Market Overview – Understanding the Bearish Structure
Bitcoin (BTCUSD) is showing a notable bearish structure on the H4 timeframe. Price has experienced a significant decline from the previous highs, with multiple structural developments s
BTCUSD | SMC and Potential Bullish Reversal.Market Overview:
Bitcoin is currently trading around 73,199, following a prolonged bearish movement from the previous resistance region. Price has experienced significant selling pressure and is now approaching an important discount zone, where a potential bullish reaction may develop.
This analysi
BTCUSD Analysis| From Bearish Pressure to Bullish Recovery.The market is currently showing signs of a potential bullish recovery after experiencing a strong bearish move from the previous resistance zone. Price has been respecting a descending trendline, creating lower highs and lower lows, which indicates that sellers have maintained control of the broader
Bitcoin Price Update – Clean & Clear ExplanationBitcoin is currently showing strong bearish momentum and facing a clear rejection from the 78,000–79,000 strong resistance zone. Price failed to sustain the bullish move above this area and quickly reversed, creating a strong sell-side reaction.
Any unexpected macro news, USD strength, risk-off sen
See all crypto ideas
GOLD Price Update – Clean & Clear ExplanationGold is showing a strong bearish reaction after facing rejection from the 4,125–4,150 key resistance zone. Price failed to hold above this important level and started moving lower, confirming increasing sell-side pressure.
Technically Price came under strong bearish pressure after hotter-than-expec
The Longer Gold Stays Below 4,070, the More Important 3,940 Hello traders! Here’s my technical outlook based on the current XAUUSD (4H) chart structure. XAUUSD previously started to decline under the Resistance Line and formed a clear descending structure. Price then entered a range near the Seller Zone and tested it with breakouts.Currently, XAUUSD is tradi
GOLD :Understanding the Next Potential Move Through Price ActionGold is currently showing signs of recovery after a significant bearish move from the previous highs. Price has reacted strongly from the major support region around 3,880, indicating that buyers have stepped into the market and initiated a meaningful bullish recovery.
However, the current price ac
XAU/USD: Trendline Broken, Sellers in ControlGold price has weakened after being rejected at the 4140–4150 resistance level. Price has broken the ascending trendline and is now trading below 4050, indicating that sellers are in control. The bearish scenario is the top priority.
1️⃣ BEARISH SCENARIO (PRIORITY)
4070–4084 (H1 Resistance) Form
XAUUSD 1H: Double Top Breakdown, Bearish Continuation in FocusHi!
Gold has formed a potential double top around the $4,140 area and is now breaking below the neckline near $4,035 to $4,050.
With price trading below the 100 SMA and RSI showing strong bearish momentum, the structure favors further downside.
I’m watching for a possible retracement into the bro
XAUUSDHello Traders! 👋
What are your thoughts on Gold?
Gold found strong buying interest around the $3,900 support zone, triggering a recovery that pushed prices back above the psychological $4,000 level.
However, the recovery faced selling pressure near the $4,200 resistance zone, where price was reje
GOLD correction bearish keep Eye on next momentum Gold remains market structure is showing bearish characteristics, with lower highs, weakening bullish momentum, and a breakdown of the previous ascending trendline.
Fundamentally, stronger-than-expected US inflation has supported the US Dollar and Treasury yields, increasing expectations of a more
DeGRAM | XAUUSD — Bulls Are Testing the Falling Resistance📊 Technical Analysis
● XAUUSD is consolidating inside a tightening structure, with price holding above a strong ascending support line while the descending resistance continues to cap the recovery.
● The setup resembles a contracting triangle, with both boundaries converging toward the current pric
Hellena | GOLD (4H): SHORT to the 3868 support area.After revising the wave count, I still consider GOLD’s broader decline unfinished. However, the strong recovery from the 3866.81 low has changed the immediate plan: the price may be forming a higher-degree wave "X" before the next bearish move.
Within this bullish correction, intermediate waves "A"
XAUUSD H2: 4,030 Holds - Is 4,093 the Next Trap?
Market Context
Gold is recovering near 4,048 after a sharp decline from the 4,148 resistance.
The recent bullish recovery from 3,920 remains significant, but two failed attempts to break 4,148 and a bearish CHoCH suggest that sellers are regaining short-term control.
Price has reacted positivel
See all futures ideas
GBP/USD 4H - Rising Wedge Breakout & US CPI CatalystGBP/USD on the 4-hour timeframe has faced strong rejection at the 1.3470–1.3504 Resistance Zone and cleanly broken below the lower trendline of a bearish Rising Wedge pattern. Price is currently trading near 1.3396, confirming a bearish structural shift below the Ichimoku cloud and EMA. Fundamentall
EURUSD 4H | Liquidity Raid & Institutional ReversalEURUSD 4H – Extreme Supply Zone & Bearish Liquidity Reversal
This EURUSD 4H chart presents a detailed ICT and Smart Money Concepts (SMC) analysis, highlighting important liquidity levels, market structure, Fair Value Gaps (FVGs), supply and demand interactions, and a potential bearish price deliver
EURUSDEURUSD is showing renewed bearish momentum after facing strong rejection from the 1.1220–1.1230 resistance region. Recent price action indicates that sellers have regained control following an unsuccessful bullish recovery.
The current structure suggests that bearish pressure remains dominant in th
AUDUSD is Nearing a Strong Resistance Area!Hey Traders, in today trading session we are monitoring AUDUSD for a selling opportunity around 0.68900 zone, AUDUSD is trading in a downtrend and currently is in a correction phase in which it is approaching the trend at 0.68900 support and resistance area.
Trade safe, Joe.
GBPUSDHello Traders! 👋
What are your thoughts on GBPUSD?
GBPUSD has been trading within a broad sideways range for several months. Price has repeatedly moved between well-defined support and resistance zones but has so far failed to break out and establish a sustained directional trend.
As long as pric
EURUSD: The 1.1270 Ceiling Remains a Major Obstacle for BuyersHello everyone, here is my breakdown of the current EURUSD setup.
Market Analysis
EURUSD previously traded inside an upward channel before breaking lower under the Trend Line. Price then tested the Resistance Zone near 1.1270 with breakouts and was rejected, confirming the bearish bias.
Currentl
USDJPY - BULLISH ASCENDING TRIANGLE
USDJPY is consolidating within a distinct 🔺 ascending triangle on the 4H timeframe. Price has repeatedly respected the rising trendline support while testing the horizontal barrier, indicating a clear bullish market bias. This compression marks a vital phase of accumulation for the pair.
⚡ Intens
EURUSD – BUY SETUP | TRIANGLE BREAKOUT WATCH...🟢 EURUSD – BUY SETUP | TRIANGLE BREAKOUT WATCH
Buy Engagement Zone: 1.1160–1.1170
Upside Price Milestones:
- 🎯 Target Alpha: 1.1195
- 🎯 Target Beta: 1.1220
- 🎯 Final Objective: 1.1240–1.1250
🛑 Structural Invalidation: 1.1140
Technical Market Analysis:
EURUSD is approaching a critical decision po
E U R J P Y : (€177 100 Buy Stop)EURJPY – BUY Trade Analysis
EURJPY is showing a bullish market structure, with price action suggesting the possibility of further upward movement. The chart indicates that buyers are maintaining control, supported by an ascending trendline that continues to provide dynamic support. The current setu
EURUSD Long: The Latest Bounce Gives Bulls Another ChanceHello traders! Here’s my technical outlook based on the current EURUSD (1H) chart structure. EURUSD previously traded inside an ascending channel and tested the Demand Zone multiple times. Price then bounced, showing signs of buyers defending support.
Currently, EURUSD is trading below the 1.1170 S
See all forex ideas
Trade directly on Supercharts through our supported, fully-verified, and user-reviewed brokers.