Nasdaq at a record: the buy is the retest, not the highThe daily trend is up: 11 of 11 of our trend measures agree, and the 4H chart has made higher highs and higher lows since 16 Sep.
The zone: 31,143 to 31,282. It is the old breakout level, and buyers defended it on 7 Oct.
Plan
Trigger: a retest of 31,282 that holds. Price is near 31,385, so this is
Where the world does markets
Join 100 million traders and investors taking the future into their own hands.
Get started for free$0 forever, no credit card needed

Supercharged
Supercharts

$NPC 1D - Limit Long setup (mid Nov TP)With GTA 6 ready to be released on 19 November, which is a highly anticipated event overall, it makes sense to bet on its related meme.
With Non Playable Characters (NPC's) gaining more and more AI mechanics, this exact narrative makes sense to capture everyone's attention as one of the ways how th
BNB: Bullish Until Key Support BreaksGETTEX:BNB Update
#BNB is still holding inside the broader rising channel on the 4H timeframe, which remains important for the short-term structure. As long as price continues to respect this channel and stays within the current range, the broader bullish momentum remains intact.
On the daily tim
The AI Boom Is Running on Borrowed Money. Should Traders Worry?The AI boom has found a new investor: The bond market.
The artificial intelligence boom has produced extraordinary revenue, record-breaking stock rallies and a seemingly endless appetite for Nvidia NASDAQ:NVDA chips. Now comes the bill.
SpaceX NASDAQ:SPCX is seeking $40 billion in financing
STX Building a Triangle Squeeze, Watching for BreakoutNASDAQ:STX continues to coil inside a multi-month symmetrical triangle, with higher lows pressing against a descending resistance trendline.
Price is currently trading just below the key breakout level near 866. The longer this compression persists, the greater the potential expansion move once pr
BTCUSD (Bitcoin) : Bearish Retest Setup Target $80,000 SupportExecutive Summary
Bitcoin (BTCUSD) has broken down below its ascending trendline support and local consolidated structure on the 4-hour time frame. Price action projects a corrective pullback toward the Fib retracement confluence zone before extending downward toward the major daily support level n
Short-Term Peak Range: 2654.48 ~ 2753.63
Hello,
Nice to meet you, fellow traders.
If you follow me, you can always receive new information quickly.
Have a great day today as well.
-------------------------------------
The volatility period lasts until October 7.
Therefore, it is important to observe the price range in which newly fo
USD/JPY builds a right shoulder - what breaks the neck?There is a head and shoulders forming on this chart, and the right shoulder is being built this week. It is not complete, and the level that would complete it is almost 200 points below where price is trading.
USD/JPY is 158.206 with the 09:00 UTC candle barely open. The pair has spent six sessions
NASDAQ 100 | ABCD Breakout & Midterm Q4 SeasonalityThe US Tech 100 has broken out to fresh all-time highs, and the daily chart now shows three things lining up: a completed ABCD continuation structure, a confirmed hold above the Point B swing high, and a clean bullish Bill Williams Alligator. Seasonality also favors the bulls going into the US midte
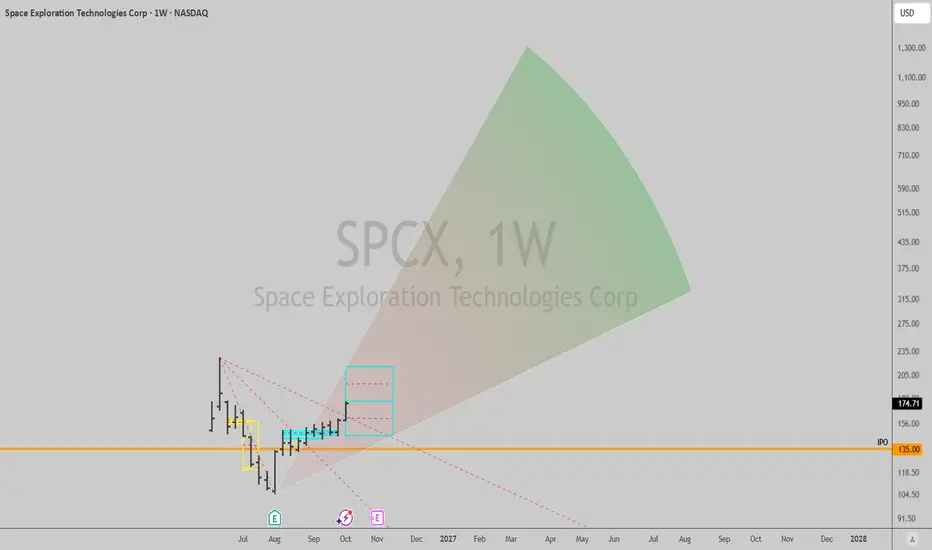
SPCX: weekly uptrend signal firedSpaceX triggered a weekly uptrend this week, trading through 173.44 after the post-IPO flush into August and a few weeks of basing just above the 135 IPO price. Back in August, right after its first earnings report, there wasn't enough history to read a trend on this chart at all. Now there is, and
See all editors' picks ideas
RedK Indicator Amplifier (RedK i-Amp)🟩 What is RedK i-Amp?
-------------------------------
RedK i-Amp is not an indicator in itself - it's a "wrapper" utility that "amplifies" another "source" indicator by improving its visual and alerting capabilities.
RedK i-Amp hooks to another indicator's plot and enables the addition of the fol
TASC 2026.10 A Low-Risk ETF-Trading Strategy█ OVERVIEW
This script implements concepts from a short-term ETF investment strategy outlined by Markos Katsanos in the article "Selecting Strong ETFs While Avoiding Sharp Overbought Reversals" from the October 2026 edition of TASC Traders' Tips . The strategy analyzes Katsanos' custom relative s
Buyers & Sellers Profile + Dynamic S/R (Zeiierman)█ Overview
Buyers & Sellers Profile + Dynamic S/R (Zeiierman) is a volume-profile and market-structure indicator designed to combine a large rolling Buyers/Sellers Volume Profile with dynamically generated support and resistance levels.
Instead of treating the volume profile and swing structure
Vol-Control Fund PositioningThe investors who sell because nothing happened
In 2017 the American stock market was so calm that a whole class of institutional portfolios held more equities than their own capital, simply because the rules they follow told them to. Reconstructed with the model behind this indicator, their estim
RedK Multi-Modal TrailingStop (RedK MMTStop)█ RedK MMTStop - Release Notes
Introduction & background
RedK MMTStop is a Multi-Modal Trailing Stop indicator - Let's quickly explore the "trailing stop" concept first as a refresher - then explain what a multi-modal trailing stop indicator does.
A "Trailing Stop" is what helps traders avoi
Trend Target Ribbon [BOSWaves]Trend Target Ribbon - ALMA Conviction Trend Detection with Integrated Structure-Based Position Planning and R-Multiple Target Tracking
Overview
Trend Target Ribbon is an ALMA-based trend identification system that combines slope-normalized momentum confirmation with standard deviation band
Wyckoff [theUltimator5]This indicator was designed to be a comprehensive, intuitive, overly engineered algorithm that plots Wyckoff accumulation and distribution patterns on the chart as they arise. It shows the current status of the regime on a side panel, while also overlaying the accumulation or distribution schematic
XeL OnlineRecursionXeL OnlineRecursion is a Pine Script library for online and streaming statistical estimation on continuous numerical and financial data.
The library is designed around recursive statistical populations whose retained state is updated observation by observation. Most recursive components use consta
Dual-Phase Reversal by DGTDual-Phase Reversal • Exhaustion, Pivots & Pressure
Dual-Phase Reversal (DPR) is a two-phase market exhaustion framework that tracks directional momentum through Momentum Exhaustion and Terminal Exhaustion . It combines sequential price conditions, Momentum Shift initiation, phase qualificatio
Zeiierman Trend Pressure (Zeiierman)█ Overview
Zeiierman Trend Pressure (Zeiierman) is a multi-layer trend pressure and exhaustion oscillator designed to visualize short-term momentum, persistent trend structure, directional pressure, and exhaustion states within a normalized 0 to -100 range.
Instead of relying on a single osci
See all indicators and strategies
Community trends
Netflix - This stock will double soon!🎥Netflix ( NASDAQ:NFLX ) is retesting massive support:
🔎Analysis summary:
Netflix is right now retesting the major previous all time high created back in 2021. And at the same time, Netflix is also testing its two decade long channel support trendline. If Netflix creates confirmation, the fol
The AI Boom Is Running on Borrowed Money. Should Traders Worry?The AI boom has found a new investor: The bond market.
The artificial intelligence boom has produced extraordinary revenue, record-breaking stock rallies and a seemingly endless appetite for Nvidia NASDAQ:NVDA chips. Now comes the bill.
SpaceX NASDAQ:SPCX is seeking $40 billion in financing
MICRON Dotcom vs A.I Bubble Comparison. Case for $400 correctionMicron Technology (MU) is showing strong signs of a strong correction half-way through its A.I. Bubble structure. This is what the stock experienced in the middle of the Dotcom Bubble after peaking in September 1995 and correcting aggressively to its 1M MA50 (blue trend-line) and bottoming right bel
MCD: Rebound Ahead?McDonald’s remains in a pronounced downtrend, with successive lower highs and lower lows since the March peak near $340.
On this daily Heikin Ashi chart, the recent sequence of red candles highlights persistent selling pressure. Smaller candles and the appearance of green near the marked $229.20 su
MU: Massive Bullish Triangle-Formation, Breakout Incoming!Hello Community,
welcome to my new analysis of MU on the daily timeframe perspective. In the recent times, I have spotted interesting stocks that have solid potential for upside, converting into worthwhile trading opportunities. One of these stocks is MU. With MU, I spotted interesting signs that
IBM #2: The July 2026 Low Still StandsIn the first idea the level I watched was the 224 area, where the channel lower band ran close to the 0.5 line. Holding that zone kept the July 2026 low as the low of this trend.
Since then IBM rallied to the 0.382 line, around 250, and turned there, with Pearson’s R still at 0.91. On the way back
NVDA (NVIDIA Corporation) Analysis on 1-Hour Timeframe - NASDAQ.Option 1 (Professional):
NVDA Bearish Breakdown? | BOSS Confirmed | My 3 Targets - $228, $218, $208 | NVDA Analysis
Option 2 (Catchy):
NVIDIA (NVDA) Ready To CRASH? | Break Of Structure (BOSS) | 3 Big Targets Inside
Option 3 (Short):
NVDA Stock Analysis Today | Range Breakdown | Target $208
### D
AAPL | The Divergence Trap: Apple's $485 Golden Slingshot | LONGI called the top on the $4.37 trillion "iStock" and braced for a 65% crash.
I was dead WRONG.
The market didn't break the floor; it built a trampoline. Here is why Apple’s engine is fully refueled and where the chart is heading next.
1. The Momentum Slingshot (Divergence Reset)
That terrifying
McDonald’s: Downward Move ContinuesOver the past two weeks, McDonald’s has continued its downward move, although the downside momentum has recently weakened significantly. Our primary view is that MCD remains in a decline, with some additional downside still expected in the near term. Once an interim low has been established around t
See all stocks ideas
Oct 9
DALDelta Air Lines, Inc.
Actual
1.72
USD
Estimate
1.77
USD
Oct 9
HOVRNew Horizon Aircraft Ltd.
Actual
−0.04
USD
Estimate
−0.09
USD
Oct 9
CCELCryo-Cell International, Inc.
Actual
0.16
USD
Estimate
0.03
USD
Oct 13
DPZDomino's Pizza Inc
Actual
—
Estimate
4.36
USD
Oct 13
JNJJohnson & Johnson
Actual
—
Estimate
2.50
USD
Oct 13
WFCWells Fargo & Company
Actual
—
Estimate
1.85
USD
Oct 13
JPMJP Morgan Chase & Co.
Actual
—
Estimate
5.93
USD
Oct 13
GSGoldman Sachs Group, Inc. (The)
Actual
—
Estimate
12.86
USD
See more events
Community trends
BTCUSD 1D | SMC Market Structure Liquidity & Trendline AnalysisBTCUSD 1D | SMC Market Structure, Liquidity & Trendline Analysis
Detailed Educational Description — Candle-by-Candle Analysis
This BTCUSD 1D chart focuses on Smart Money Concepts (SMC), market structure, liquidity zones, support and resistance, Fair Value Gaps (FVG), Order Blocks, and trendline b
Bitcoin Double Top Breakdown — Is $77.5K the Next Target?Bitcoin ( BINANCE:BTCUSDT ) has declined more than 5% over the past three days and lost the Support Zone($81,950-$82,960).
BTC has started to react from the 50_SMA(Daily), but several macro and market risks continue to increase short-term bearish pressure.
Can buyers defend the psychological $80,0
B T C : ($82 600 Buy Stop)BTCUSD — LONG SIGNAL
Entry: 82,000–82,400
Stop Loss: 81,200
TP1: 83,500
TP2: 84,500
TP3: 85,500–86,000
Risk/Reward: roughly 1:2.5–1:4 depending on entry.
Analysis
BTC has completed a strong corrective decline into the Wave (4) area, where the chart shows a defined demand/support zone. The projecte
BTCUSDT Long: Stabilizes Above 82,200 — Bulls Prepare for PushHello traders! Here’s my technical outlook based on the current BTCUSDT (2H) chart structure. BTCUSDT previously traded inside a descending channel before breaking higher and forming a range. Price then tested the Demand Zone near 82,200 and bounced along the Demand Line.
Currently, BTCUSDT is trad
BTCUSD: Higher Prices Still Struggle to Attract CapitalBitcoin has bounced sharply from the 80,500 area, but the strength of the rebound is not what matters most to me. The bigger question is how the market responds as Bitcoin is repriced at higher levels. So far, buying interest has not shown the conviction needed to turn this recovery into a genuine r
BITCOIN: THIS Underlying Pattern is Guiding the NEXT Market!Hello Community,
welcome to my new analysis of BITCOIN from a broader timeframe perspective. BITCOIN is following an interesting pattern that I recently spotted. This pattern is particularly interesting because BITCOIN has already managed to bounce off the $60,000 level, confirming it as a pivotal
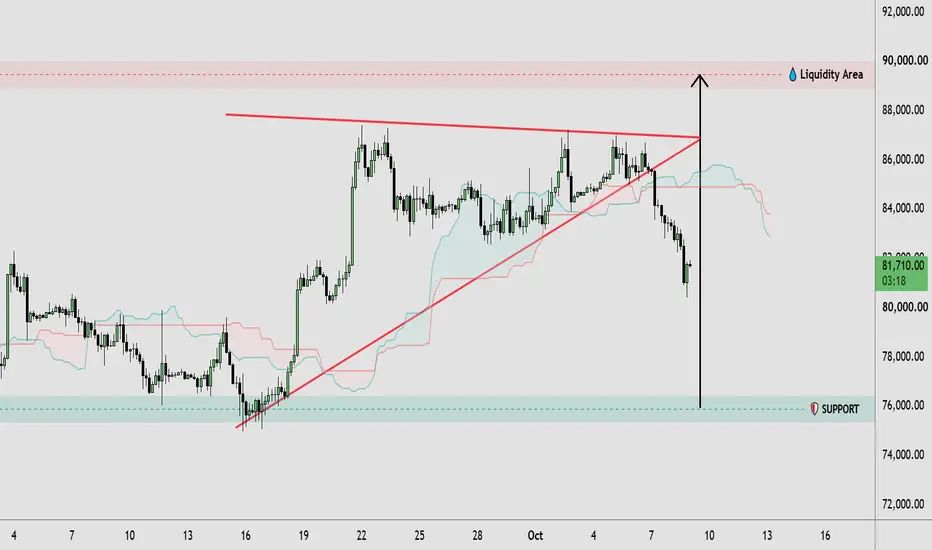
BTCUSDT — Trendline Breakdown: Will Support at 76K Hold?🔹 BTCUSDT is showing a bearish shift in price action after breaking below the rising trendline of the previous consolidation structure. The rejection near the 86,000–87,000 resistance area was followed by strong selling pressure, pushing price toward the 81,700 region. This breakdown suggests weaken
BTCUSD — Market Structure, Liquidity & Order Block AnalysisThis analysis focuses on the current price structure of BTCUSD using market structure, liquidity,
order blocks, BOS/CHoCH, and key support/resistance areas.
Price has previously established a strong bullish expansion from the 80,000–80,500 order block and reversal area, followed by a significant mo
BITCOIN The Growth Model that maps the new Bull Cycle.Last time we looked into the Rainbow version of the Logarithmic Growth Curve (LGC) of Bitcoin (BTCUSD), was on July 18 2025 (see chart below), when the price was at $120k and we warned that it has entered the Profit Taking Zone of the Bull Cycle and that risk should be limited:
Well now the mar
Funding Rates and PositioningFunding rates are often reduced to a simple rule: high positive funding means too many longs, while deeply negative funding means too many shorts. That interpretation misses what funding is actually designed to do.
Perpetual futures do not expire like traditional futures contracts, so exchanges nee
See all crypto ideas
XAUUSD — GOLD KEY DECISION ZONE | BULLISH REACTION OR BEARISH XAUUSD — GOLD PRICE ACTION EDUCATION | EVERY CANDLE HAS A REASON
Gold is approaching a major decision zone. The chart shows a broader bearish structure, repeated selling pressure, liquidity reactions, and a possible bullish recovery from the support area. To understand what Gold may do next, we mus
THE KOG REPORT - UpdateEnd of day update from us here at KOG:
Price went up into our hotspot, Asia gave us a nice short trade and the bias level held us up. Now we have broken upside but this ranging is getting frustrating and now we're late session. For that reason, I'd say we'll re-visit this tomorrow and look for a
GOLD: Bulls Look to Reclaim the UptrendGOLD: Bulls Look to Reclaim the Uptrend
Yesterday at the US market open, Gold fell aggressively for no reason, as we had 4067. There was no news or data at that time. However, let's assume that it was normal from the expectations of the FOMC minutes.
Yesterday, the FOMC minutes didn't move the ma
GOLD - A short squeeze in 4220 could trigger a decline IC:XAUUSD remains within a medium-term bearish trend. However, the market is recovering locally as part of a liquidity-hunting phase. The key focus is on the current trading range.
The dollar is stagnating as traders take profits ahead of the long weekend in the U.S. and await next week’s key
GOLD: Bearish Structure Still Intact, Key Resistance Ahead#GOLD Update
Gold is bouncing from $4,065, but in my view this is still a counter-trend correction within the broader bearish structure.
The interesting part is that the descending trendline and the Fixed Range Volume Profile POC are coming together around the $4,140–$4,170 area. This makes that z
XAU/USD 4H Trendline Breakout (09.10.2026)XAU/USD has confirmed a clean trendline breakout on the 4H timeframe following a sharp rejection from the 4,086.00 to 4,117.00 support zone.
Bullish momentum is building as buyers regain control above the falling channel structure. The market faced strong rejection from recent lows, clearing the pa
GOLD Giving A Good Bullish P.A , Long Setup To Get 500 Pips !Here Is My 30 Mins GOLD Chart , We Entered a sell trade yesterday when we have a breakout to downside and we got 200 pips and now the price again above our res with 4H Candle , so we have a good chance to buy again from the same support in the area between 1114.00 tp 1120.00 , and we already got a n
GOLD Bearish Pressure Resistance Rejection DownsideGold is currently showing a recovery within a broader bearish market structure. After a strong downside move, price has rebounded toward the 4,190 / 4,225 resistance zone.
Recent market weakness has been linked to a stronger US Dollar, rising US Treasury yields, and concerns that the Federal Reserv
XAUUSD Descending Channel Meets Key Support | Liquidity in Focus🔹 XAUUSD Price Action Analysis: Gold continues to trade within a descending channel, reflecting bearish market structure with lower highs and lower lows. Recent price action shows a rebound from the 4,050–4,080 support zone, with price currently consolidating around 4,146. The 4,220–4,240 liquidity
XAUUSD H1: Breakout Confirmed, But Is Gold Ready for 4,220?Gold has finally broken free from the descending structure that controlled price action over the past several sessions. After sweeping liquidity below 4,100, buyers gradually rebuilt momentum, formed a bullish Change of Character (CHOCH), and pushed price through the upper boundary of the bearish ch
See all futures ideas
EURUSD Faces Another Sell Off Risk Beneath the 1.1220 CeilingHello traders! Here’s my technical outlook based on the current EURUSD (1H) chart structure. EURUSD previously started to decline under the Trend Line and tested the Seller Zone multiple times. Price then formed a Fake Breakout and was rejected, continuing the bearish structure. Currently, EURUSD is
EURUSD – H4 – Descending Trendline Breakout & Bullish Reversal SEURUSD – H4 – Descending Trendline Breakout & Bullish Reversal Setup
EURUSD is currently trading around 1.12250 and showing signs of recovery after a sustained bearish move. Price is testing the descending trendline, while the 1.11402–1.11650 support zone remains a key area to watch.
📌 Support Zon
GBP/USD Falling Wedge Breakout (09.10.2026) GBP/USD has confirmed a clean breakout from a well-defined falling wedge pattern on the 2-hour timeframe.
A strong candle close above the descending trendline and the Ichimoku cloud near 1.3235 confirms the bullish breakout. This clears the path toward the first resistance at 1.3350, followed by
USDJPY Bullish Continuation Setup**USDJPY is holding above a rising trendline, showing a bullish structure despite the recent pullback. A rebound from the trendline support could push price toward the **158.22 target**, with a stronger bullish continuation potentially reaching the major **158.90–159.00 resistance zone**.
**Targets:*
USDCHF is Nearing a Strong Support!Hey Traders, in today's trading session we are monitoring USDCHF for a buying opportunity around 0.82600 zone, USDCHF is trading in an uptrend and currently is in a correction phase in which it is approaching the trend at 0.82600 support and resistance area.
Trade safe, Joe.
EUR/USD - H1 Trendline breakout#EURUSD #Forex #TradingView #TechnicalAnalysis
The Euro is regaining ground against the Greenback as a slight pullback in US 10-year Treasury yields eases immediate dollar demand.
While elevated crude oil prices keep global inflation expectations high, market expectations of ECB rate stability com
EURUSD: Potential Double Bottom PatternEURUSD: Potential Double Bottom Pattern
EURUSD is likely to form a potential double bottom pattern.
The price tested 1.1160 these days and could not fall any lower.
The chances that we may be in a double bottom pattern are increasing today.
I see an upward move in EURUSD. The first resistance ar
EURUSDEURUSD is currently trading within a corrective recovery after a strong bearish move. Price is attempting to stabilize around the 1.1180–1.1220 demand/support area, but the broader structure remains under pressure while price stays below the descending trendline.
The next move will depend on whethe
EURUSD: Potential Slide To 1.1150 After Its Latest ReversalHello everyone, here is my breakdown of the current EURUSD setup.
Market Analysis
EURUSD previously traded inside a range and triangle structure before breaking higher. Price then entered a downward channel, tested the Resistance Zone near 1.1280, and was rejected, confirming the bearish shift.
EURUSD 2H: Support Holds as Bulls Target Channel RecoveryEURUSD 2H: Support Holds as Bulls Target Channel Recovery
EURUSD is holding the marked support area near 1.1150 after trading inside a descending channel. A sustained recovery and breakout above the channel resistance could open the way toward the next resistance zones.
📈 Recovery Path
🎯 Objective
See all forex ideas
Trade directly on Supercharts through our supported, fully-verified, and user-reviewed brokers.