PYTH: buybacks strong, waiting for a pullbackPYTH powers a market-data oracle where more than 120 exchanges and trading firms publish prices directly. The business is growing fast: annual recurring revenue reached 11.5 million dollars in September, up 86% quarter over quarter. On October 8, a standing DAO rule took effect that sends 100% of th
Where the world does markets
Join 100 million traders and investors taking the future into their own hands.
Get started for free$0 forever, no credit card needed

Supercharged
Supercharts

USD/CHF Rises as SNB Stays Dovish and U.S. Dollar FirmsUSD/CHF stayed firm on Monday as geopolitical stress and another jump in energy prices drove demand back toward the U.S. Dollar. Brent pushed above $106 after fresh attacks in Saudi Arabia, keeping the inflation story alive ahead of Wednesday’s U.S. CPI report. Markets see only about a 19% chance of
Long-term value unlock in RNIRNI is trading very far below NAV and we think that there is a longer-term opportunity for a value unlock here.
The stock sold off on the back of a disposal and the large amount of cash on the balance sheet. The market is waiting to see what the company intends to do with all that cash, and thus fa
ADOBE (Photoshop & Illustrator): A New Technical Era (2026)I named the title "ADOBE (Photoshop & Illustrator): A New Technical Era (2026)" because we have multiple confluences on multiple timeframes occurring synonymously.
Monthly:
Long-term diagonal TL from 1987, hit multiple times. Now the price has given signs of life at that TL in 2026.
A-B-C complet
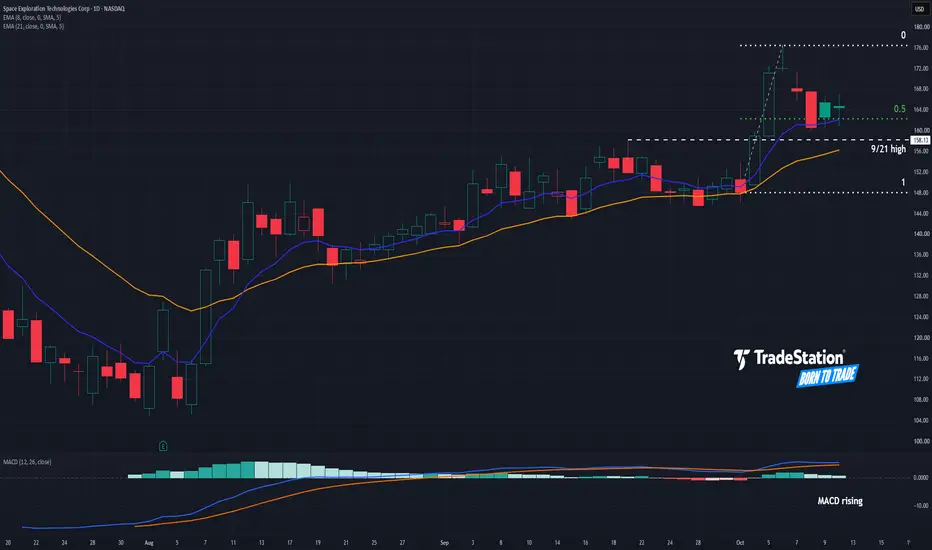
SpaceX Steadies After SurgeSpace Exploration Technologies jumped earlier this month, and some traders could think the ascent will continue.
The first pattern on today’s chart is the October 1-6 rally. The space-launch company has pulled back to hold a 50 percent retracement of that move, which may confirm the direction of th
USDCAD H1 | Bullish Bounce Off Key SupportMomentum: Bullish
Price is currently above the ichimoku cloud.
Buy entry: 1.42291
- Overlap support
- 78.6% Fib retracement
- 100% Fib projection
Stop Loss: 1.42019
- Swing low support
Take Profit: 1.42851
- Swing high resistance
High Risk Investment Warning
Stratos Markets Limited (fxcm.com/uk
Ethereum: Rising Channel Keeps $3,000 in FocusEthereum price action continues to trade within a local ascending channel, maintaining a sequence of higher lows as buyers defend key support. The channel's lower boundary, situated around $2,400, remains an important technical level, with recent price action respecting this region and preserving th
Elliott Wave Analysis – XAUUSD | October 13, 2026
1. Daily Timeframe (D1)
D1 momentum has reached the overbought zone and is now preparing to reverse downward. If today's daily candle continues to maintain bearish momentum, the market could enter a corrective decline lasting approximately 3–5 trading days.
At this stage, as we expect wave (Y) t
Gold Hints at Quiet Accumulation as Bulls Seek DipsGold made a mild attempt to reverse its trend and break above its bearish trendline, although falling volumes suggest the move lacks strong bullish conviction for now. However, the sharp rejection of $4,100 ahead of the bounce suggests quiet accumulation may be underway, with bulls potentially seeki
Copper at a Record, but the Tariff Trade Is FadingOn 9 September 2026, front-month LME copper set an all-time high of $14,940 per tonne. COMEX Copper Futures followed with its own record of $6.9285 per lb on 22 September. Both have since pulled back.
The force behind the rally was not a shortage. Traders were pricing in an expected US tariff on i
See all editors' picks ideas
RedK Indicator Amplifier (RedK i-Amp)🟩 What is RedK i-Amp?
-------------------------------
RedK i-Amp is not an indicator in itself - it's a "wrapper" utility that "amplifies" another "source" indicator by improving its visual and alerting capabilities.
RedK i-Amp hooks to another indicator's plot and enables the addition of the fol
TASC 2026.10 A Low-Risk ETF-Trading Strategy█ OVERVIEW
This script implements concepts from a short-term ETF investment strategy outlined by Markos Katsanos in the article "Selecting Strong ETFs While Avoiding Sharp Overbought Reversals" from the October 2026 edition of TASC Traders' Tips . The strategy analyzes Katsanos' custom relative s
Buyers & Sellers Profile + Dynamic S/R (Zeiierman)█ Overview
Buyers & Sellers Profile + Dynamic S/R (Zeiierman) is a volume-profile and market-structure indicator designed to combine a large rolling Buyers/Sellers Volume Profile with dynamically generated support and resistance levels.
Instead of treating the volume profile and swing structure
Vol-Control Fund PositioningThe investors who sell because nothing happened
In 2017 the American stock market was so calm that a whole class of institutional portfolios held more equities than their own capital, simply because the rules they follow told them to. Reconstructed with the model behind this indicator, their estim
RedK Multi-Modal TrailingStop (RedK MMTStop)█ RedK MMTStop - Release Notes
Introduction & background
RedK MMTStop is a Multi-Modal Trailing Stop indicator - Let's quickly explore the "trailing stop" concept first as a refresher - then explain what a multi-modal trailing stop indicator does.
A "Trailing Stop" is what helps traders avoi
Trend Target Ribbon [BOSWaves]Trend Target Ribbon - ALMA Conviction Trend Detection with Integrated Structure-Based Position Planning and R-Multiple Target Tracking
Overview
Trend Target Ribbon is an ALMA-based trend identification system that combines slope-normalized momentum confirmation with standard deviation band
Wyckoff [theUltimator5]This indicator was designed to be a comprehensive, intuitive, overly engineered algorithm that plots Wyckoff accumulation and distribution patterns on the chart as they arise. It shows the current status of the regime on a side panel, while also overlaying the accumulation or distribution schematic
XeL OnlineRecursionXeL OnlineRecursion is a Pine Script library for online and streaming statistical estimation on continuous numerical and financial data.
The library is designed around recursive statistical populations whose retained state is updated observation by observation. Most recursive components use consta
Dual-Phase Reversal by DGTDual-Phase Reversal • Exhaustion, Pivots & Pressure
Dual-Phase Reversal (DPR) is a two-phase market exhaustion framework that tracks directional momentum through Momentum Exhaustion and Terminal Exhaustion . It combines sequential price conditions, Momentum Shift initiation, phase qualificatio
Zeiierman Trend Pressure (Zeiierman)█ Overview
Zeiierman Trend Pressure (Zeiierman) is a multi-layer trend pressure and exhaustion oscillator designed to visualize short-term momentum, persistent trend structure, directional pressure, and exhaustion states within a normalized 0 to -100 range.
Instead of relying on a single osci
See all indicators and strategies
Community trends
Micron Technology - This chart is still pretty clear!💵Micron Technology ( NASDAQ:MU ) still remains clearly bullish:
🔎Analysis summary:
Micron Technology has just been trading completely sideways for over four months. But before Micron Technology entered into this consolidation, it rallied about +1,800% towards the upside. After this strong bul
SPACEX broke below its 1D MA50. Is $110 next?SpaceX (SPCX) broke below its 1D MA50 (blue trend-line) for the first time even following the break-out above it on August 26. At the same time, it broke below the 2-month Higher Lows trend-line, which is a strong confirmation that the uptrend has come to a halt.
Technically, this can extend the do
SanDisk $SNDK Is Down Sharply. Is $1,270 the Next Stop?SanDisk has fallen hard from the $1,900 area, and the chart is showing no clear sign of a trend reversal yet. The bigger question is whether this is just a pullback after a massive rally or the start of a deeper correction.
I’m leaning bearish for now. Price has broken below the rising trendline th
Datavault AI Inc. (DVLT)DVLT completed its History correction at $0.1200
Final wave comes Tricky with False break out - Bear 🐻 Trap as last Shaking out step .
Final wave come in Ending diagonal pattern formation with False Break out manner.
Target prices and Stock are free to Move up above $0.4000 - $1.00
TSMC — record quarter, so why is the stock below its EMAs?NYSE:TSM trades at the exact middle of its three-month range, with the results already out.
Is this drop a trap or a discount? The daily closed yesterday at $430.00, down 3.4% in a single session on 56% more volume than the average of the previous 21 sessions. From the October 5 high ($487.47)
AMD: Support at 50 SMA, Next Stop ATH💡 Swing setup idea
50 SMA Strategy
🔎 Analysis summary:
The stock came down to the support at the 50-day moving average. The next target is the all-time high. This alignment of trend and level makes the bounce area key to watch. The upside potential is projected toward the all-time high from the
NAK: Trendline Trap Before BreakdownAMEX:NAK is showing a clean bearish continuation structure using the latest SK + trendline manipulation framework.
The main sequence is active. We have a clear A → B structure , with the bearish ABC target still unreached , meaning there is still downside room if the sequence continues to delive
NVIDIA: Can Buyers Turn This Pullback Into a Recovery?NVIDIA briefly traded above $240 in early October, but the rally lacked the confirmation needed to turn a promising move into a stronger bullish case. By October 15, the stock had closed at $217.23. Buyers now face another test: can they rebuild momentum before the September recovery is completely u
ELF Breaks Above 110 After a long period of cosolidattionPrice is trading around 114.60 after a strong breakout candle. It is holding above the rising EMA 20, so the trend structure is intact. Volume picked up on the move, which gives the breakout more weight than the earlier tests.
The level to watch is 110: price holding above keeps the breakout alive,
See all stocks ideas
Today
RFRegions Financial Corporation
Actual
0.73
USD
Estimate
0.66
USD
Today
CFGCitizens Financial Group, Inc.
Actual
1.41
USD
Estimate
1.39
USD
Today
TFCTruist Financial Corporation
Actual
0.56
USD
Estimate
1.14
USD
Today
TRVThe Travelers Companies, Inc.
Actual
9.18
USD
Estimate
7.39
USD
Today
AEHRAehr Test Systems
Actual
—
Estimate
—
Today
CZNCCitizens & Northern Corp
Actual
—
Estimate
0.68
USD
Today
BCMLBayCom Corp
Actual
—
Estimate
0.56
USD
Today
RBCAARepublic Bancorp, Inc.
Actual
—
Estimate
1.65
USD
See more events
Community trends
BTCUSD uidity Sweep, Order Block & Bearish Continuation ScenarioThis analysis focuses on the current BTCUSD market structure, with particular attention to liquidity behavior, Fair Value Gaps (FVGs), order blocks, and potential downside continuation.
Market Structure
Bitcoin has shown a shift from bullish price action into a bearish structure after rejecting the
bitcoin at the edge, will bulls defend 80k and reach 90kBTCUSD is currently trading around 80,953, following a strong bearish move from the 85,000–86,000 region. Price is approaching a potential support zone around 78,800–79,300, where buyers may attempt to defend the market. The chart shows several FVGs and BOS levels, reflecting previous imbalances and
BTCUS Bearish Market Structure, Order Block & Liquidity TargetsBTCUSDT Analysis | Bearish Market Structure, Order Block & Liquidity Targets
Bitcoin is currently trading around the 81,160 region following a strong bearish displacement from the 83,600–84,000 resistance area. The chart indicates a continuation of bearish market structure, with multiple changes of
BTCUSD Bearish Structure | Order Block, BOS & Liquidity Target BTCUSD Advanced Market Analysis | Market Structure, Bearish Order Block, BOS & Liquidity Targets
1. Higher-Timeframe Market Structure
BTCUSD is showing signs of bearish pressure after rejecting the upper resistance area near the descending trendline. The chart shows that price previously rallied
BITCOIN broke below its 1D MA50 after 2 months! Is $70k next?Bitcoin (BTCUSD) just broke below its 1D MA50 (blue trend-line) for the first time in almost 2 months (since August 19). During the last Bull Cycle (2023 - 2025), every time BTC broke below its 1D MA50, it made a rather standard short-term correction of around -20%. In fact the weakest it registered
BTCUSDT 4H Market Analysis Supply ,Demand Zones, Liquidity Sweep
BTCUSDT 4H Market Analysis | Supply & Demand, Liquidity Sweep, FVG and Bearish Scenario
Overview
This BTCUSDT 4-hour chart presents a Smart Money Concepts (SMC)-based market analysis using price action, supply and demand zones, Fair Value Gaps (FVGs), liquidity levels, trendline support, and key
BTCUSDT Short: Rejection at 82,200 Could Drop Toward 79,000Hello traders! Here’s my technical outlook based on the current BTCUSDT (4H) chart structure. BTCUSDT previously traded inside a range before breaking lower into a descending channel. Price then tested the Supply Zone near 82,200 multiple times, where sellers rejected the upside.
Currently, BTCUSDT
USDT.D: Rising Trendline Breakdown Could Target 6.47% Liquidity 🔹 USDT.D is approaching a key resistance zone near 7.00% after forming a bullish market structure with higher highs and higher lows. Recent price action shows a rejection from the rising trendline, followed by consolidation around 6.72%, suggesting that bullish momentum may be weakening. The 7.00% r
BTCUSD Bearish Momentum Builds as Bitcoin Tests Critical SupportBitcoin (BTCUSD) is showing continued bearish pressure on the 2-hour chart after facing strong rejection from the recent resistance zone around 84,000. As shown in the chart, price has been forming lower highs beneath a descending trendline, indicating that sellers remain in control of the short-ter
The Same Candle Size Does Not Mean the Same ThingA $2,000 Bitcoin candle sounds significant until it is placed in context.
If CRYPTOCAP:BTC has spent several weeks moving only a few hundred dollars per session, a sudden $2,000 candle represents a major change in activity. If the market has recently been producing $3,000 to $4,000 daily ranges r
See all crypto ideas
GOLD Showing Strong Bullish P.A , 3 Long Setups To Get 2500 PipsHere Is My 30 Mins Chart On Gold , after this massive movement to downside that we entered a sell trades during it , now the time to find the best places to can buy to get a small retracement to upside before the price choose his next direction , so i have 3 places we can buy from it , first one and
GOLD: ONE BREATH, THEN A PUSH TO 4,244Pure price structure — no EMA, no RSI, no Volume. Just horizontal lines, two arrows and one projection zig-zag.
Horizontal levels on the chart (top to bottom): 🏁 4,245 — far top, where the green arrow points 🥇 4,208 – 4,209 — mid resistance 🥈 4,196 — near resistance, exactly our 4,193 zone 🔵 4,16
XAU/USD | More Bullish Move Ahead ? (READ THE CHART & CAPTION)By analyzing the #Gold chart on the 4H timeframe, we can see that the demand zone I highlighted around $4075 – $4120 reacted well. After dropping into this bullish order block, Gold found buyers and bounced strongly, reclaiming $4120 and pushing back toward the $4150 area.
This reaction shows
XAUUSDHello Traders! 👋
What are your thoughts on Gold?
Gold has been trading within a consolidation range for more than two weeks. As long as the price remains inside this range, expecting a strong and impulsive trending move may be premature. Under the current conditions, a range-trading strategy ( sel
XAU/USD | CPI & PPI aftermathFollowing the heavy drop because of the CPI news this week, and a small drop after the PPI, Gold has been able to recover from them, going as high as 4186, before dropping a bit again and is being traded at around 4175 level.
I expect Gold to continue towards 4200 and then 4227, as there's a buysid
Gold 30Min Engaged ( Bullish & Bearish Reversal Detected )
HANZO MARKET LIQUIDITY REPORT
USOIL
Timeframe: 30min (Volume Basis)
Scale: Higher Timeframe Context / Deep Volume analysis
━━━━━━━━━━━━━━━━━━━━━━
Market Observation
This analysis is focusing on structural behavior, liquidity zones, Volume analysis
and key areas of interest within the current range
XAUUSD 4H | ICT Liquidity Trap & Reversal ModelXAUUSD 4H — ICT Liquidity, Market Structure & Macro Outlook
Is Gold preparing for a bullish reversal after a sell-side liquidity sweep, or is the recent recovery simply a temporary retracement within the broader bearish structure?
This analysis combines ICT concepts, liquidity mapping, market stru
SILVER (XAG/USD): Confirmed Pullback Trade📈SILVER appears to be oversold following yesterday's bearish movement.
As it tests a key daily horizontal support level, i see a clear intraday bullish reversal.
The price formed a cup and handle pattern on an hourly time frame and has successfully breached its neckline.
We may anticipate a pullba
GOLD Price Update – Clean & Clear ExplanationGold is currently showing a bearish market structure despite a sharp recovery from the recent lows around 4,090 after facing strong selling pressure, the price rebounded toward the 4,140 / 4,160 area, indicating that buyers are attempting to regain control.
For now, Gold remains at a critical decis
XAUUSD 4H | SMC Market Structure Liquidity & Trendline EducationXAUUSD 4H — Professional Candle-by-Candle Education
This chart explains how Smart Money Concepts (SMC), liquidity, market structure, FVGs, Order Blocks and the bearish trendline work together. Every candle should be read according to its location, previous structure and reaction from important zone
See all futures ideas
EURUSD Faces a Fresh Test After Buyers Lose the 1.1240 BattleHello traders! Here’s my technical outlook based on the current EURUSD (3H) chart structure. EURUSD previously started to decline and formed a descending wedge structure under the Resistance Line. Price then tested the Seller Zone with a fake breakout and was rejected. Currently, EURUSD is trading b
EURUSD Bearish Pressure Continues | Resistance RejectionEUR/USD remains under pressure after repeatedly failing to hold above the 1.1230–1.1245 resistance area. The recent recovery from the 1.1160 zone looks more like a corrective rebound than a confirmed trend reversal.
Fundamentally, the pair has also been sensitive to U.S. inflation, Treasury yields
EURUSD 1D Bulilsh Market Structure Buy-Side Liquidity Analysis EURUSD 1D | Bearish Market Structure & Sell-Side Liquidity Analysis
EURUSD Daily timeframe is showing a clear bearish structure after rejection from the 1.16178–1.17000 premium region. Price has been forming lower highs and lower lows, while multiple FVGs and liquidity areas continue to guide the c
GBPUSD - 4h Falling Wedge Breakout GBP/USD has confirmed a well-defined wedge breakout on the 4h timeframe following a sharp bounce from the 1.3135 support base.
A clean breakout above wedge opens the path toward resistance. A sustained 4h close below 1.3135 invalidates the immediate bullish outlook.
🟢1st Resistance — 1.3380
🟢2nd R
EURUSD Price Update – Clean & Clear Explanation
EUR/USD is showing a strong bullish recovery after sweeping liquidity below the demand zone around 1.1130–1.1145. Buyers stepped in aggressively, pushing the price back above the previous resistance areas and breaking through the descending trendline that had been controlling the market for several
EURUSD: Three False Breakouts - In Focus: Bullish RecoveryEURUSD: Three False Breakouts - In Focus: Bullish Recovery
EURUSD is showing signs of a potential bullish reversal after three false breakouts around the 1.1160 support zone.
Each downside break was quickly rejected, with price recovering sharply after the latest drop toward 1.1110–1.1120.
Price
16.10.26 Daily ForecastPairs on Watch -
FX:GBPAUD : We can see a very clear daily push from the value area below and all of the volume that was built previously, we have a clear target above to aim for and now it is a case of waiting for that next continuation to build. I will be looking for price to stack on the 1H,
EURUSD | Bullish Breakout & Bullish Continuation Setup# EURUSD | Bullish Breakout & Bullish Continuation Setup
### Fundamental View
EURUSD is attempting a bullish recovery following its recent decline, supported by a pullback in the US dollar and easing US Treasury yields. On October 15, the dollar retreated from its recent highs as Treasury yields f
USDCAD - BEARISH WEDGE BREAKOUT
USDCAD is consolidating within a 🔺 descending wedge, currently hovering near the lower boundary after multiple rejections at resistance. This 🧭 bearish price action signals weakening momentum as buyers struggle to reclaim higher ground within the broader structure.
Price is now testing the wedge s
EURUSD: Buyers Are Finally Fighting BackEURUSD has been under pressure for quite some time, but the way price is reacting around the 1.1150–1.1180 area is starting to make the picture more interesting . After several weeks of near-total seller control, downside momentum is beginning to slow, while attempts to push the pair lower are incr
See all forex ideas
Trade directly on Supercharts through our supported, fully-verified, and user-reviewed brokers.