


Where the world does markets
Join 60 million traders and investors taking the future into their own hands.
Explore featuresExplore featuresExplore features
Tesla's upcoming Robotaxi launch: stock trading idea 8/04/24Tesla Inc. is gearing up for a significant reveal on 8 August this year, as it plans to introduce its much-anticipated robotaxi. This move comes at a time when the company is navigating sluggish sales and increasing competition from more affordable Chinese electric vehicles. Elon Musk, the CEO of

(NASDAQ:TESLA) STOCK UNDER $100.00?WATCH SUPPORT LEVELS TO PAY ATTENTIO!
Short Term Price Target
$155.27 to 146.54
1. Tesla's Stock Price Below $100.00: The fact that Tesla's stock could drop below $100.00 suggests a significant bearish sentiment in the market. Investors may be concerned about the company's performance or broader

Bitcoin: is price set to get cheaper or.....?Today's focus: BTCUSD
Pattern – Range, seller test.
Support – 62,000 area
Resistance – 73,000 area
Hi, traders; thanks for tuning in for today's update. Today, we are looking at BTC on the daily.
With sellers continuing to check buyers, it continues to look like we could see a new move at supp

Weekly Technical Analysis 15/04/2024Start your week by identifying the key price levels and trends.
The SpreadEx Research team has analysed the most popular markets, including stocks, indices, commodities & forex.
*KEY
Trend direction is set by the slope of the VWAP
Trend phase is determined by the current price relative to the VWAP

Corn Prices To Fire Up on Rising Energy CostsIt is official. Inflation is back. But not everywhere. Food inflation is on the decline. All three major crops, Soybean, Wheat, and Corn have declined substantially. Bearish sentiments rings loud across agri with ample supplies combined with solid harvest expectations.
Among crops, corn has fared

Big Levels on Big TechBig technology stocks have moved sideways for the last month. Now there could be some important levels for names like Nvidia as investors digest today’s higher-than-expected inflation report.
The main pattern on today’s chart is the March 11 low of $841.66. This level has provided support since the

📈 Bullish Perspective on BTC: On a Higher Time Frame Analysis!
Despite recent market jitters and bearish sentiments stemming from a significant drop, I remain bullish on Bitcoin, particularly in a higher time frame analysis. The recent downturn may seem daunting, but it's crucial to recognize that such fluctuations are often part of Bitcoin's volatile nature,


TSMC Secures Historic $11.6 Billion U.S. InvestmentIn a groundbreaking move to bolster domestic semiconductor manufacturing, Taiwan Semiconductor Manufacturing Co. ( BCBA:TSMC ) has secured a monumental $11.6 billion investment from the United States. The initiative, spearheaded by President Joe Biden, underscores a strategic effort to fortify Ameri

See all editors' picks ideas
NVDA: Week of April 15And finally, NVDA.
Setup is beraish on the 4 hour, with the immediate point being the yellow line in the chart. We usually overshoot these Heikin ashi setup targets so look to the calculate low targets starting at 849.
I was thinking we would fall back down into the gap support and then break bel

DJT STOCKS BULLISH SENTIMENT SPOTTEDA weekly strong bullish bar would suggest more buyers interested in the shares of the company.

TSLA MEGA Bearish StructureTime for a new updated chart in TSLA.
TSLA has now formed a MEGA Bearish structure. While we are not near a Key area at the moment. The initial formation does not look good for the Bulls going forward.
At this point, it would take a lot of effort (buying) to change the message of the market in th


RF Regions Financial Corporation Options Ahead of EarningsAnalyzing the options chain and the chart patterns of RF Regions Financial Corporation prior to the earnings report this week,
I would consider purchasing the 18usd strike price Calls with
an expiration date of 2025-1-17,
for a premium of approximately $1.65.
If these options prove to be profitable

First Solar Fights HigherFirst Solar has been fighting higher, and some traders may see further upside.
The first pattern on today’s chart is the December 28 closing price of $173.22. FSLR jumped above that level early in the month and has now pulled back to hold it. Has old resistance become new support?
Second, prices a

TESLA STOCK: WHY IS NO ONE SEEING THIS????2014 - 2019, we formed this very distinct support level that had 3 touch points before price took off...
The last 2 touch points out of the 3 during 2014-2019, saw the weekly RSI dip below 30
2022 we dipped below 30 & formed our 2nd touch point of this cycle
When Weekly RSI hits 30 again, $110 co

Tesla Valuation back to 2010 IPO$TSLA has had wild swings in valuation from under 2 times sales and over 20 times sales in the past few years. Granted, you have to know the future to know what the sales are, but in 2019 it was insanely cheap just as the Model Y was just starting to sell. The MODEL Y is why Tesla has done so well i

"Mara: The Matador Muncher"By combining diligent research, proactive risk management, and a focus on long-term value, you can navigate the volatility surrounding Mara mining stock and potentially capitalize on the anticipated BTC halving event.

NVDA reversal- thing of beauty.NVDA touched the 50EMA just for a second and rallied off of those levels. Target 890/900.

See all stocks ideas
Community trends
NVDA: Week of April 15And finally, NVDA.
Setup is beraish on the 4 hour, with the immediate point being the yellow line in the chart. We usually overshoot these Heikin ashi setup targets so look to the calculate low targets starting at 849.
I was thinking we would fall back down into the gap support and then break bel
DJT STOCKS BULLISH SENTIMENT SPOTTEDA weekly strong bullish bar would suggest more buyers interested in the shares of the company.
TSLA MEGA Bearish StructureTime for a new updated chart in TSLA.
TSLA has now formed a MEGA Bearish structure. While we are not near a Key area at the moment. The initial formation does not look good for the Bulls going forward.
At this point, it would take a lot of effort (buying) to change the message of the market in th
RF Regions Financial Corporation Options Ahead of EarningsAnalyzing the options chain and the chart patterns of RF Regions Financial Corporation prior to the earnings report this week,
I would consider purchasing the 18usd strike price Calls with
an expiration date of 2025-1-17,
for a premium of approximately $1.65.
If these options prove to be profitable
First Solar Fights HigherFirst Solar has been fighting higher, and some traders may see further upside.
The first pattern on today’s chart is the December 28 closing price of $173.22. FSLR jumped above that level early in the month and has now pulled back to hold it. Has old resistance become new support?
Second, prices a
TESLA STOCK: WHY IS NO ONE SEEING THIS????2014 - 2019, we formed this very distinct support level that had 3 touch points before price took off...
The last 2 touch points out of the 3 during 2014-2019, saw the weekly RSI dip below 30
2022 we dipped below 30 & formed our 2nd touch point of this cycle
When Weekly RSI hits 30 again, $110 co
Tesla Valuation back to 2010 IPO$TSLA has had wild swings in valuation from under 2 times sales and over 20 times sales in the past few years. Granted, you have to know the future to know what the sales are, but in 2019 it was insanely cheap just as the Model Y was just starting to sell. The MODEL Y is why Tesla has done so well i
"Mara: The Matador Muncher"By combining diligent research, proactive risk management, and a focus on long-term value, you can navigate the volatility surrounding Mara mining stock and potentially capitalize on the anticipated BTC halving event.
NVDA reversal- thing of beauty.NVDA touched the 50EMA just for a second and rallied off of those levels. Target 890/900.
See all world ideas
SymbolPrice & chgMarket cap
SymbolMarket cap / Price
SymbolPrice & chgEmployees
SymbolEmployees / Price
spy short its time 3-8% correctionNew thread
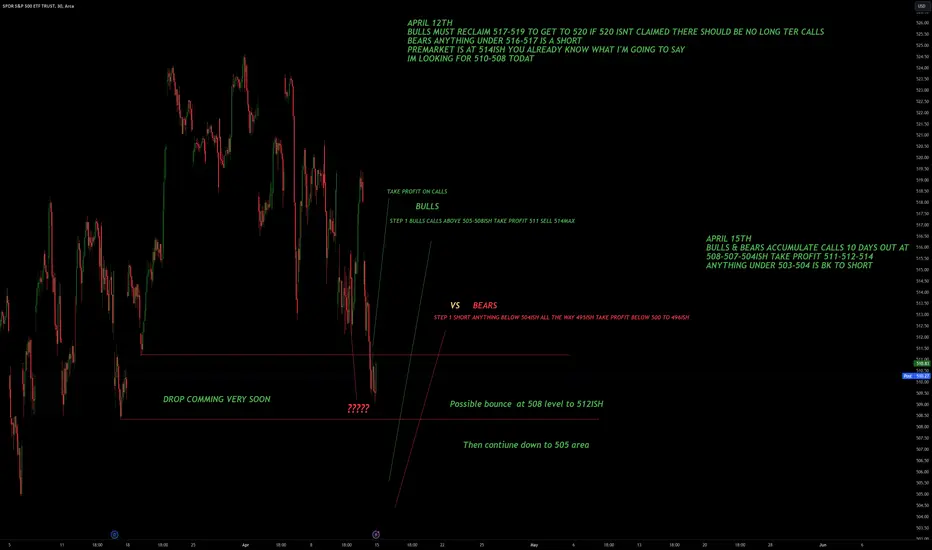
April
510-505
I would personally buy calls all the way down to 505
10 days out for a bounce 514
Taking profit 512-514
Then I would get bk into shorts all the way down 505 or lower as low as 495 this upcoming week
weekly range keeping us in a corrective phase no higher 516
as low as 49
$SPY April 19 2024AMEX:SPY April 19 2024
Strength is only above 515+- at the moment.
Today 497 should break and probably AMEX:SPY will touch 4892no 94 levels being 100 average in the daily.
In 15 minutes we have 100 averages at 504 and 200 averages at 50 levels.
Both will be resisted at least once.
For the da

TLT... Time to Buy?Good R/R for a long down here, especially with a potential for a weekly hammer to set up a higher low from the 2023 bottom. Especially with a seeming "risk off" in the markets could be an attractive place to look for returns. Been bleeding for a long time... plus take a look at the volume since the

Spy trade tomorrow3 scenarios as describe in the picture to reach next support around 494. If breaks 506 then downtrend over for now.

SpyI want to start off With DJI, NYA, IWM, XLF, And XLV. Those indexes and sectors are more cylicals and they led the slide this week.
DJI (Dow jones)
37,800 is previous resistance of the bullflag.. 37,800 will now be support. I think we dead cat here before eventually sliding to 37,000.
37,00

SPY: Week of April 15Last week I just did a longer timeframe update.
I am going to continue with the larger timeframe as the focus but will also give the shorter timeframe levels for next week.
You can see we've just chilled below the 3 month threshold for far too long. It's 504 on the horizon, that's for sure.
We w

TURNING POINT FOR $SPY??Today looks to be a fight to stay above $500 for $SPY. Starting to see some consolidation in these areas. If AMEX:SPY can avoid a pit fall for the rest of the day, Calls will be on the menu. Nice simple and quick play. RSI already at 30.

Early unconfirmed long position.In $SPYThe confluence at the lower lever and the 1 hour chart reacting at that level has me buy a very small low risk call option trade.

IWM | Incoming Bull Run | LONGiShares Russell 2000 ETF seeks to track the investment results of the Russell 2000 Index, which measures the performance of the small-capitalization sector of the U.S. equity market. The fund generally invests at least 80% of its assets in the component securities of its underlying index and in inve

Technical Analysis for SPYas of Latest Market Data.The SPDR S&P 500 ETF Trust (SPY) exhibits signs of bearish momentum, underpinned by several technical indicators and recent price action. The ETF has breached crucial support levels, auguring a potential continuation of the downtrend.
Recent Price Action:
The latest candlestick pattern on the daily

See all ETF ideas
Community trends
SCHD
Schwab US Dividend Equity ETFUVXY
ProShares Trust Ultra VIX Short Term Futures ETFNIFTYBEES
NIPPON INDIA MFSQQQ
ProShares UltraPro Short QQQTQQQ
ProShares UltraPro QQQSPY
SPDR S&P 500 ETF TRUSTXLK
SPDR Select Sector Fund - TechnologyDIA
SPDR Dow Jones Industrial Average ETFUSO
United States Oil FundIBIT
iShares Bitcoin TrustSymbolPrice & chgNAV total return 1Y
SymbolNAV total return 1Y / Price
SymbolPrice & chgDividend yield FWD
SymbolDividend yield FWD / Price
🅱️ Bitcoin Halving 2024 | Visiting $55,555 $44,444 and $33,333 The Bitcoin 2024 Halving is only 5 days away —according to CoinMarketCap— and this is truly a major event in this market. Bitcoin's halving has a huge effect on the entire Cryptocurrency market in a positive way.
The halving is something good and was implemented as a strategy/feature/solution/techn

PIVOT POINTS: Same pattern with targets $67k to $71kAny questions? Follow the trend lines with lows and highs. 14D TF dotted blue lines squeezed into a 4HR TF. Shows the end of dip but I have another idea showing a possible dip to $57k zone but no confirmation yet.
BTC same pattern but with different volume.
BTC not ready to fall deep.
Added a s

BTCUSD: Bearish strategy continues to growHello friends!
Currently, BTCUSD is still stuck in a downtrend. Factors suggest that bearish momentum is still dominating the market, with the possibility of further strong price declines as prices break below support and remain below the 34 and 89 day moving averages (34 and EMA 89). This shows tha

The Final Drop?Great R/R on this entry
I like the potential for a typical "flat correction" here on a larger fractal wave, which i have labelled WXY and its subwaves all good enough to expect a completed 5 wave move (impulse) lower here, highlighted by the pink wave count.

Bitcoin - more crash is coming! -21%Bitcoin crashed significantly, as I warned you in one of my previous analyses:
What now? Is the crash over? I don't think so! The halving event is in a few days, and huge volatility is expected. The problem is that below the current price, we have a double bottom pattern, and there is a lot of li

BTCUSDT: Prospects are still beneficial for the Seller!Hello everyone, what do you think? Should we buy or sell BTCUSDT today?
Currently, BTCUSDT continues to be stuck in a downward trend, showing little fluctuation and maintaining the same trading levels as at this time yesterday. The downward momentum remains dominant, and the outlook continues to lo

Bitcoin Halving Idea is Pumping LONG PositionsBitcoin Halving Idea is Pumping LONG Positions
All the focus is on BTC halving these days.
After the price moved below 61K yesterday we can see that BTC is rising again the bullish momentum.
This is shown clearly through a bullish pattern.
BTC created a solid breakout and it may rise further fro

BITCOIN → Continued consolidation before a strong move BINANCE:BTCUSD is testing 71572 and forming a false breakout, I have emphasized our attention to liquidity above this level in a separate idea. Trading inside the range after capturing liquidity continues and the market appears to be preparing for a halving.
(April 6 idea: BITCOIN → Trading ins

Wave 5 is probably too largeHey guys and girls,
Here is an updated chart from my (Feb 29, 2024) post.
Technical Section:
Wave 3 < 161.8% of wave 1
Wave 4 = 38.2% of wave 3 (Wave a = 38.2% of wave 3, It did)
Wave 5 is probably too large
Extended Wave 5 (Target 2 ) = 100% x length of (beginning of Wave 1 to top of Wave

Dominant Trend Directional change [UP]Today we cover:
> counter trend trading
> using the correct Gann Square
> new set ups
> and everything else that came to mind ;)

See all crypto ideas
Community trends
TONUSDT
Toncoin/TetherONTUSDT
Ontology / TetherUSJ
JTOUSDT
JTO / TetherUSONGUSDT.P
Ontology Gas / TetherUS PERPETUAL CONTRACTWIFUSDT
WIF / TetherUSBTCUSDT
Bitcoin / TetherUSBTCUSD
BitcoinTIAUSDT
TIA / TetherUSGALAUSDT
GALA / TetherUSBTCUSD
BitcoinSymbolPrice & chgMarket cap
SymbolMarket cap / Price
SymbolPrice & chgTVL
SymbolTVL / Price
EURUSD continues to decline!Hello dear friends, today the EURUSD continues its decline, following the trend of recent days, with the trading price hovering around 1.062 and losing 0.15% so far today as of this writing.
The downtrend persists as hawkish comments from Federal Reserve officials provide some support for the US Do

EURUSD continues to declineHello friends!
As James mentioned in the previous analysis EURUSD is currently in a recovery phase with the market correcting and capturing liquidity receiving support at 1.0660. However, overcoming the 1.0750 resistance level remains the challenge and target.
On the news impact: EUR/USD continues

EURUSD - BUY SIGNALBuy opportunity in the FX:EURUSD with a target at 1.07000 for a profit of 30 pips.
With the data worse than expected from the news of Second-hand home sales, I expect the price rises to the level of 1.07000
Guys, what do you think? Leave a comment with your thoughts.

GBP/JPY pair is signaling a selling opportunityCurrently, the GBP/JPY pair is signaling a selling opportunity as it hovers around the 192.11 mark. This indicates a potential downward movement in the pair's value. Traders could consider setting multiple take-profit levels to capitalize on various price points, such as at 191.50, 191.30, and 190.5

AUSSIE WOULD BLEED, YO!As we take possession of the Q2 trading session, AUDUSD has just decided to roll up its bullish sleeves and change the bias BACK to the downside!
Expect a potential 300 or more pip drop from the aussie dollar!!!!
#FxC.

Sell GBPJPY BreakoutThe GBP/JPY pair on the M30 timeframe presents a potential selling opportunity due to a recent downward breakout from a well-defined pattern.
Key Points:
Sell Entry: Consider entering a short position (selling) below the broken support level, ideally around 192.80. This offers an entry point clos

Potential Sharp Decline Looms for EUR/USD as USD StrengthensThe significant recovery of the US Dollar (USD) has interrupted the EUR/USD's rebound process after it reached a peak around 1.0690 on Thursday. This currency pair declined below the 1.0640 level in Friday's Asian trading session.
Based on technical analysis, the technical indicators are supporting

eurcad-Weekly bull move pullback holing right on 26 ema.
-Weekly reverse hnd formation.
-Daily consolidation area with absorption around the 40% of the original bull move.
-Second consolidation with a shakeout around 50% of the move.
Entry after a confirmative strong bull candle-move or after a bul

GBPJPY 4 Hour Trading Journal GBPJPY 4 Hour Trading Journal
On the 4 hour chart price has primarily been offering premium prices. After April 14 bull run price was rejected creating equal highs.
Since Monday price is delivering to a tight institutional flow and I anticipate raid on stops soon. Trouble is will price gravitate

EURUSD: approaching a possible swing buying opportunity FX:EURUSD dxy remained extremely bullish in recent few weeks which resulted EURUSD to drop significantly leaving many gaps in the price action. What we want now for price to drop further which will result price to fall under the discounted price zone. This is the last chance for price to rebound, i

See all forex ideas
4800 DRAFT 9-2, GOLD IS GETTING READY TO GO ... NO WHEREIntroduction - Bulls are holding 43-year trend line at 2360s while NASDAQ bears formed a soft ceiling at 2400 that should hold past through May 1st FOMC. The result has gold range bound, predominantly between 2367-2392 for the incoming nine trading days, after which gold should head for 2444 and hi

Gold price increases on weekendsToday, gold prices continued to rise sharply on the last trading day of the week, increasing by nearly $35 to reach a peak of $2418 before settling around $2410 at the time of writing.
The momentum behind gold's rise remains intact after it rebounded from the 34-day EMA line, with technical factors

Hellena | Oil (4H): Long to resistance area of 87.47.Dear Colleagues, at the moment the price has made a strong downward movement. I suppose that the price is in wave "4" and can continue its movement to the support area of 80.22, but I consider only long positions, because the price can make a reversal at once. I recommend to work with pending orders

Gold price continues to grow from 2375 USD?Hello dear friends! It's a pleasure to meet you again and discuss with you in today's chat.
As such, XAUUSD continues to consolidate at high levels with continued growth, without a false break of the uptrend channel occurring, it is currently touching $2406 at the time of writing, marking an increa

GOLD 4H CHART ROUTE MAP UPDATEHey Everyone,
Another great day on the chart today buying multiple dips inline with our chart idea.
Yesterday after hitting our bullish target at 2389, we got the rejection, as no ema5 lock above this level.
The rejection maintained support above 2349 Goldturn, allowing us to buy dips back to 238

Gold's rise is weak or will fall backFrom the daily chart of gold, a K-line combination similar to the "evening star" appeared near the historical high, suggesting that the gold price has initially peaked, and we need to beware of the possibility of a decline or a deep correction in the market outlook. Since gold showed an uptrend patt

The bulls won after a tense battleGold regained bullish traction and broke above the $2,400 mark, showing some short-term consolidation for now. Technical indicators retreated from extreme overbought levels, suggesting that some decline may be imminent in the short term. However, the possibility of a slide higher is yet to come, as

Gold | Current Status Review Gold couldn't break through the resistance at 2390 yesterday and experienced a price drop down to 2360. Today, gold is moving back towards the 2390 resistance; if it fails to break through, we can expect further price decline to 2340. Otherwise, if the resistance is broken, we anticipate touching pr

Geopolitical Unrest Drives Gold Beyond $2,400The political tension between Israel and Iran continues to escalate, propelling Gold prices to regain momentum and surpass the $2,400 mark in Friday's Asian trading session. If this tension continues to escalate, forecasts suggest that Gold prices could experience even stronger growth, potentially r

gold market has shown a promising buy signal at a price of $2388"The gold market has shown a promising buy signal at a price of $2388.20. This indicates a favorable opportunity for investors to consider purchasing gold at this particular price point. With a targeted trajectory, aiming for $2400 and $2410, this buy signal suggests potential upward momentum in the

See all futures ideas
10 yr yield targets are being met into 4.70plus .Bonds are ready for a nice Short term rally be long TLT and do NOT be short stocks
UK Bond Steps and ForcesThis is my perspective on the forces that might apply on the UK 10Y Gilt. It can climb along the red rectangles to fall down to the big green or if the first red rejects it or the bottom arc attracts it, we might see support in that area. The vertical green is a special one where unusual or special

20 year bond yields entering Rotation DownwardAnother TLT play is about to start. The 20 year bond yields are rejecting off the channels resistance and will likely move back down to the 200 mda and maybe the bottom of the 4 months upward channel. TLT will respond inversely to this. I have been playing TMV and TMF back and forth since Novembe

Bonds, DXY are down. Commodities down too, no hedgeHistorically when Bonds and US Dollar DXY are down, then Commodities go up. Their inverse correlation is currently broken.
Just something to monitor and warning that something is out of order which should be ringing alarm bells

TLT Long - We may see an improvement in a narrow windowI expect a rise around TLT 89.8 at 16.04. This means a pullback of 4.53 for US10Y.

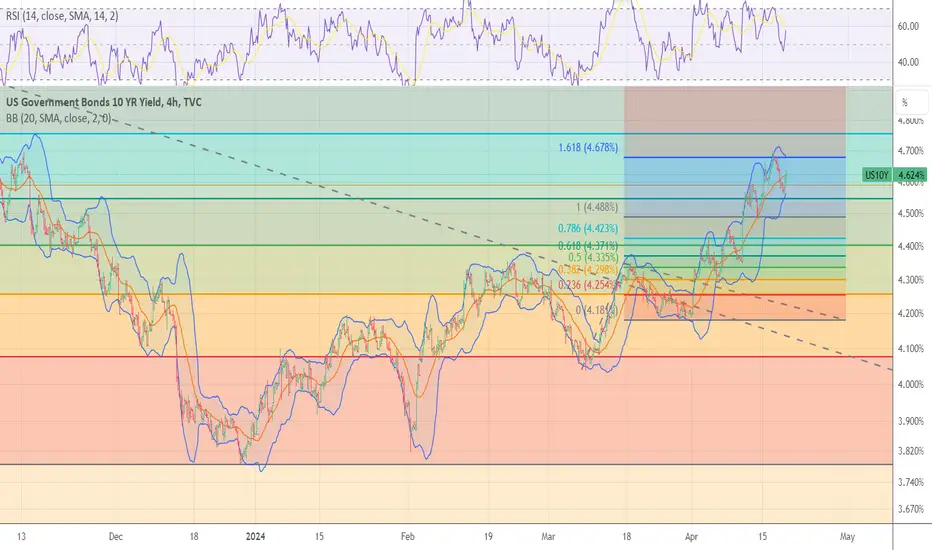
US Government Bonds 10 YR Yield X Right Prices for year 2024. US Government Bonds 10 YR Yield X Right Prices for year 2024.
4.729%
4.892%
4.862%
4.954%
April Distribution price: 5.031%, 5.061%
It may also arrive at 5.212%
__________________________________
After the Distribution price we will expect a drop to, 4.622% range.
Then expecting the prices fo

10 Yield yield is ready to destroy SPYThe 10-year yield is in a huge symmetrical triangle.
Break out of it would trigger a massive move in rates. Rates are moving up due to the very hot inflation report.
Let's see if will it be rejected or if this will be the end of the bull market for now!

US-German yield spreads suggest higher Dollar IndexIt's reasonably well appreciated that the biggest component of the dollar index DXY is the euro. Therefore when trying toanalyse the future direction of the Dollar one needs to consider what is happening to the spread between yields in the two main economic areas (US and Germany as a proxy). If we l

Long term bonds are much higher than when bank fiascoShort term bonds are still trading below the bank fiasco crisis.
1 & 2YR Yields.
However.......
Long term #yield is higher than it was during the bank fiasco.
10 & 30 YR #Yield.
Normalization of the curve is still a ways off.

US30Y: A Deep Dive into US30Y Bond Swing-Trade OpportunityThe US30Y bond is a type of loan that the United States government takes from investors. It's called a "30-year bond" because it takes 30 years for the government to pay back the loan in full. When you buy a US30Y bond, you're essentially lending money to the government, and in return, they promise

See all bonds ideas
SymbolPrice & chgYield
SymbolYield / Price
SymbolPrice & chgYield
SymbolYield / Price
Trade directly on the supercharts through our supported, fully-verified and user-reviewed brokers.


