Nvidia CEO in Hot Water Over Two Affairs. Will He Lose His Job?Alexa, play Careless Whisper by George Michael.
Nvidia NASDAQ:NVDA is at the core of the AI revolution, everyone knows that. Apparently, nobody anticipated that its biggest disruption might come from the CEO's love life.
Jensen Huang, the leather-jacket-wearing architect of the AI boom, is figh
Where the world does markets
Join 100 million traders and investors taking the future into their own hands.
Get started for free$0 forever, no credit card needed

Supercharged
Supercharts

How much of the drop did the bounce recover?A bounce looks bigger when you only measure it from the low. Put the drop back into the picture.
On this 15 minute NASDAQ:NVDA chart, price was around $175 before the selloff, reached the high $150s and bounced around $160. Use rounded levels to see the scale: a move from $175 to $158 lost $17. A
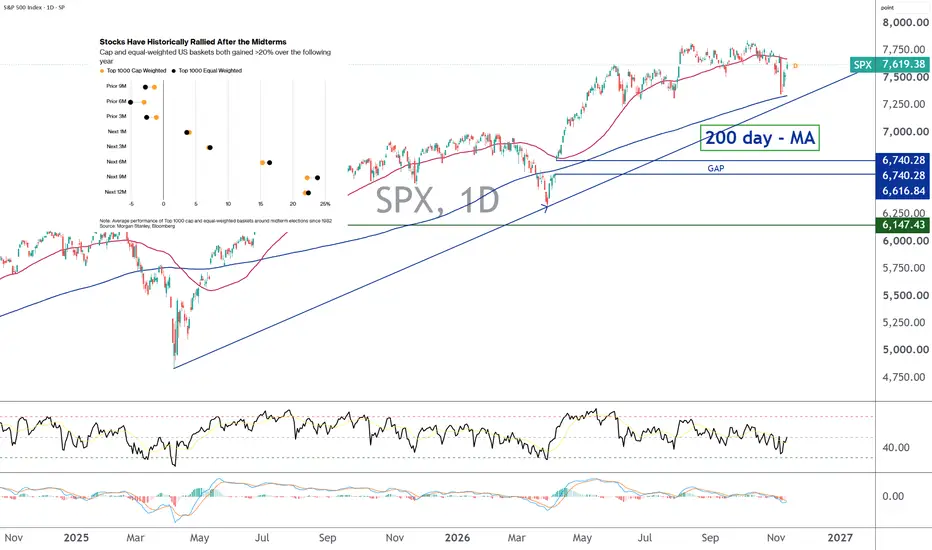
S&P 500, underlying bullish trend remains intactThe US stock market went through a short-term consolidation phase in October, amid profit-taking in the technology sector, and more particularly in semiconductors, which underwent a controlled retracement over six months, from June to early November, in the wake of the US midterm elections.
This co
Elliott Wave Analysis – XAUUSD | November 12, 2026
1. Daily Timeframe (D1)
Daily momentum is currently declining, suggesting that the ongoing bearish correction or sideways consolidation could continue for another 1–2 days.
XAUUSD has declined to fill the previous bullish Fair Value Gap (FVG) and is now approaching a bullish Order Block (OB) on
Bullish bounce at 50% Fib resistance?XAU/USD is falling to a support level, a pullback support that aligns with the 50% Fibonacci retracement and could bounce from here to our take profit.
Entry: 3,991.39
Why we like it:
There is a pullback support level that aligns with the 50% Fibonacci retracement.
Stop loss: 3,879.03
Why we like
Microsoft's Window of Opportunity (for OnlyBearFriends)A stalwart of what long term success can look like in global markets, NASDAQ:MSFT has increased shareholder value by 3500% (35X) since 2009; surviving shifts in technology, advancements in digital risk/threats and the changeover of many CEOs.
However, like all assets tradeable by humans (or bots
AAVE got Kraken and Avon news and no bid. I sell the retestKraken's parent Payward bought an undisclosed amount of AAVE on 5 Nov, and Aave Labs bought the Avon team on 6 Nov. AAVE flushed to 122.27 on the day of the Payward news, bounced to 131 and has not moved since. Good news and no bid. X is bullish only, all tokenization talk.
Trend: AAVE ran 85.02 (1
NVIDIA - Could Primary Wave 4 Shake Wall Street?The World's Leading Stock Could Bring Down the House
NVIDIA tagged the high time frame 2.618 level earlier back in May '26 and has been showing signs of weakness ever since. In my proposed count of impulsive waves, this area could likely mark primary yellow Wave 3, where we could expect a high time
Bitcoin to new lows from here $42-54k next, $10-20k afterThe title of the chart isn't meant to trigger people. I already know what the comments will be "tHeRe's No waY we CoulD EveR See $10k."
Alright, well let me explain the thinking of what's happening and then explain things from a technical perspective.
I think what's happening in the crypto market
DXY: Major Support Test at 102 - Bullish Rebound Ahead?Executive Summary & Market Context
The U.S. Dollar Index (DXY) is currently exhibiting a crucial structural retest following a sustained medium-term recovery phase. Price action has pulled back directly into a high-confluence support zone near the 102.00 psychological handle and previous resistance
See all editors' picks ideas
RedK DualTF Volume-Accelerated CCI (RedK VA-CCI)🟩 RedK VA-CCI Release Notes
===========================
RedK VA-CCI is a modern take on the Commodity Channel Index (CCI) classic indicator.
RedK VA-CCI leverages the core CCI concept, and builds around it to provide traders with comprehensive insights, dual timeframe capabilities, and many other
Volume Profile Anatomies (D / B / P / Double Zone)You know how volume profiles all kind of look like blobs, and people talk about "D-shaped" and "P-shaped" profiles like everyone's supposed to just see it? This indicator does the squinting for you — it builds a real volume profile from the chart's bars, finds the POC and value area, then politely t
Higher Timeframe Trend Frontier (Zeiierman)█ Overview
Higher Timeframe Trend Frontier (Zeiierman) is an adaptive higher-timeframe indicator designed to visualize HTF opening levels, developing price structure, directional movement, and potential trapped buyers and sellers.
Unlike traditional HTF indicators that simply plot historical
PineTunnel█ OVERVIEW
PineTunnel is a Pine Script library that re-implements TradingView's
strategy.* broker emulator for indicator() scripts. It mirrors the full
strategy.* namespace one-to-one — 114 exports: 88 functions, 18
constants and 8 types — covering entries, brackets, trailing stops,
OCA groups,
Confluence Profile█ OVERVIEW
Confluence Profile is a tool for finding places where several independent technical factors point to a similar price level. It does not give buy or sell signals. Instead, it shows where Fibonacci levels, Order Blocks, Fair Value Gaps and volume nodes cluster on the chart, and how many of
Rolling Candle Profile with Buy/Sell Signals (Zeiierman)█ Overview
Rolling Candle Profile with Buy/Sell Signals (Zeiierman) is a dynamic price-pressure indicator that visualizes buying and selling dominance, directional pressure concentrations, and weak-pressure regions directly on the chart.
The indicator constructs a 12-layer Rolling Pressure Prof
Innovation Adaptive Kalman Filter Oscillator█ OVERVIEW
The Innovation Adaptive Kalman Filter (IAKF) is a modern implementation of the Kalman filter that uses its own prediction errors to detect abnormal measurements and adapt its measurement-noise estimate.
This indicator is an oscillator that adapts recent research in GPS and inertial nav
Market Matrix (Zeiierman)█ Overview
Market Matrix (Zeiierman) is a multi-timeframe market analysis dashboard that brings together price structure, trend, momentum, and market strength into six compact indicator panels.
Instead of switching between multiple indicators and timeframes, Market Matrix displays higher-timefr
RedK Indicator Amplifier (RedK i-Amp)🟩 What is RedK i-Amp?
-------------------------------
RedK i-Amp is not an indicator in itself - it's a "wrapper" utility that "amplifies" another "source" indicator by improving its visual and alerting capabilities.
RedK i-Amp hooks to another indicator's plot and enables the addition of the fol
TASC 2026.10 A Low-Risk ETF-Trading Strategy█ OVERVIEW
This script implements concepts from a short-term ETF investment strategy outlined by Markos Katsanos in the article "Selecting Strong ETFs While Avoiding Sharp Overbought Reversals" from the October 2026 edition of TASC Traders' Tips . The strategy analyzes Katsanos' custom relative s
See all indicators and strategies
Community trends
Nvidia CEO in Hot Water Over Two Affairs. Will He Lose His Job?Alexa, play Careless Whisper by George Michael.
Nvidia NASDAQ:NVDA is at the core of the AI revolution, everyone knows that. Apparently, nobody anticipated that its biggest disruption might come from the CEO's love life.
Jensen Huang, the leather-jacket-wearing architect of the AI boom, is figh
NFLX: Bearish Trendline Breakout or Further Downside?🔹 NFLX remains under bearish pressure after facing strong rejection near the $82–$83 resistance area in September. Since then, price action has developed a descending structure with consistent lower highs and lower lows, while the falling trendline continues to define the broader downtrend. Currentl
How much of the drop did the bounce recover?A bounce looks bigger when you only measure it from the low. Put the drop back into the picture.
On this 15 minute NASDAQ:NVDA chart, price was around $175 before the selloff, reached the high $150s and bounced around $160. Use rounded levels to see the scale: a move from $175 to $158 lost $17. A
MICROSOFT looking for a pull-back before $720 rally.Microsoft (MSFT) has been trading within a 5-year Channel Up since its November 29 2021 High, having made its recent Higher Low on a Double Bottom exactly within the Buy Zone (0.786 - 0.0 Fibonacci range).
As long as the 1D MA50 (blue trend-line) supports, we expect to see a medium-term pull-back s
MSFT double top: a daily close under 505 targets 455Microsoft ( NASDAQ:MSFT ) has hit the 550-559 area twice, and the daily chart is starting to look like a double top.
The pattern: the first high is 551.15 (October 13) and the second 559.15 (November 4); in between, on November 2, it dropped to 504.96, which acts as the neckline. The height is
NVIDIA CORP (NVDA:US)NVIDIA CORP
I am seriously considering a large entry at levels around $120, which represents a 50% correction from the previous high.
🏦 Fundamentals → WHAT I want to own
📊 Technical Levels → WHERE I want to accumulate
⏳ Patience → WHEN I choose to act
The market constantly creates imbalances.
Adobe - Still following this flag formation!📷Adobe ( NASDAQ:ADBE ) is currently retesting support:
🔎Analysis summary:
Since the previous all time high back in 2021, Adobe has been correcting over -70%. This aggressive behavior though is really not surprising looking at the history of Adobe. Right now, Adobe is just retesting major supp
SNDK: A Strong Bounce, But Can Buyers Sustain the Recovery?
SanDisk (SNDK) is showing signs of a recovery after a sharp decline, but I’m more interested in whether buyers can maintain this momentum than in chasing the latest green candle.
On the 4H chart, SNDK closed at 977.71, gaining 13.69%. Price has bounced strongly from the 833–920 support region, su
APD rebounds to $315 with $320 resistance in sightAir Products and Chemicals has bounced back to $315.18 after a sharp reversal from roughly $324 sent the stock briefly below $303.18, the 78.6% Fibonacci retracement of the latest upswing. The rebound has reclaimed the 38.2% retracement at $313.88 and is now testing the prior breakout area around $3
ASUR: Payday for the bears?Asure Software ( NASDAQ:ASUR ) develops cloud-based payroll and HR management systems. Today, it's delivering not just paychecks, but technical signals.
Technicals: Weekly Timeframe
Since 2023, the chart has shown a multi-year accumulation phase ranging from $6.28 to $12.74. The lows of $6.28 an
See all stocks ideas
Community trends
BTCUSDT Short: The Latest Reaction Favors a Test of Lower PricesHello traders! Here’s my technical outlook based on the current BTCUSDT (4H) chart structure. BTCUSDT previously formed a Double Top near the highs and entered a descending channel. Price then tested the Supply Zone and was rejected.
Currently, BTCUSDT is trading below the 75,100 Supply Zone while
BTCUSD: Sell-Side Liquidity Sweep and Reversal Setup (4H)Bitcoin has been trading inside a descending channel on the 4H, printing lower highs and lower lows with multiple BOS along the way. Price has now dropped into the weak low and sell-side liquidity near 72,600, a classic area where stops get swept before a potential reversal.
Trade idea: Long
Buy are
Token Unlocks Do Not Always Cause SellingToken unlocks are frequently discussed as bearish events because they increase the amount of cryptocurrency that can potentially enter circulation. When a large allocation becomes available to investors, team members, or early contributors, traders naturally become concerned that the additional supp
ETHEREUM (ETH/USD): Strong Bearish Signs!📉Ethereum experienced a significant correction from the 2,000 psychological level.
Following a test of the highlighted intraday resistance cluster, the market started to show strong bearish signs by breaching the resistance line of a falling wedge pattern on the hourly time frame.
These bearish si
BTCUSD Analysis| From Bearish Pressure to Bullish Recovery.The market is currently showing signs of a potential bullish recovery after experiencing a strong bearish move from the previous resistance zone. Price has been respecting a descending trendline, creating lower highs and lower lows, which indicates that sellers have maintained control of the broader
TAOUSDT - Readiness to continue falling towards 190.0BINANCE:TAOUSDT.P is under bearish trend pressure and, in the absence of a bullish driver, is highly likely to continue falling. The market is declining...
Bitcoin has entered another bearish zone of 75K–67K, and it is quite likely that, while there is no fundamental support and no bullish dri
BTCUSD – Bearish BOS & Liquidity Low Taken CRYPTO:BTCUSD
Bitcoin (BTCUSD) is currently displaying a strong bearish market structure on the 30-minute timeframe, with sellers maintaining control following multiple downside movements and structural breakdowns.
After previously consolidating near the 76,000 region, BTCUSD experienced significa
BTCUSD H4 | Liquidity Sweep & Bearish Continuation SetupBTCUSD H4 | Liquidity Sweep & Bearish Continuation Setup
📊 Market Overview – Understanding the Bearish Structure
Bitcoin (BTCUSD) is showing a notable bearish structure on the H4 timeframe. Price has experienced a significant decline from the previous highs, with multiple structural developments s
BTC: Bearish Momentum Is Dominating the MoveBTC: Bearish Momentum Is Dominating the Move
From our previous analysis, BTC reached the first target at 73500. The price found some buyers again taking BTC up to 75500 but couldn't manage to rise more.
Considering that the price is making lower lows, chances are it will fall further as shown in
BTCUSDT Weekly Analysis | Bearish Outlook Key Support & Downside BTCUSDT – MEGA BEARISH WEEKLY ANALYSIS | WHY BITCOIN COULD DROP FURTHER | GLOBAL POLITICAL & ECONOMIC RISKS
BITCOIN (BTCUSDT) – WEEKLY TIMEFRAME
MARKET BIAS: BEARISH BELOW KEY RESISTANCE
Bitcoin is facing multiple technical and macroeconomic challenges. Our weekly analysis focuses on market str
See all crypto ideas
GOLD Price Update – Clean & Clear ExplanationGold is showing a strong bearish reaction after facing rejection from the 4,125–4,150 key resistance zone. Price failed to hold above this important level and started moving lower, confirming increasing sell-side pressure.
Technically Price came under strong bearish pressure after hotter-than-expec
GOLD New Range Created , Best Buy&Sell Zones Spotted , 2000 PipsHere Is My 15 Mins GOLD Chart , As we see the price touched the selling area and melted to downside and avoid all my supports m and now the price created a new range , we have 2 places for sell and 1 place for buy , i`m focusing on short entries now , we can enter a sell trade now cuz the price clos
GOLD @ 3982: Testing the Golden OTE Zone!Gold continues to sink deeper into the key Key Demand zone (3969–4021) and is currently trading around 3982.19. Price has broken through the Fib 0.618 level (3991.5) and is approaching the golden OTE ratio zone at 0.705 (3969.6). This is an extremely sensitive liquidity area that directly determines
XAUUSD: Two Rejected Highs Leave Searching for Lower SupportHello everyone, here is my breakdown of the current XAUUSD setup.
Market Analysis
XAUUSD previously traded inside a range under the Trend Line before forming a Double Top near the Resistance Zone. Price then rejected from 4,040 and started moving lower, confirming the bearish bias.
Currently, XA
XAG/USD 1H: Potential trendline breakdownXAG/USD | 1-hour technical and fundamental outlook
Silver is showing signs of weakness after moving below its rising trendline on the 1-hour chart. The recent price action suggests that bullish momentum is weakening, putting the short-term market structure under pressure.
The key question now is w
Gold Breakdown — Bearish Structure Confirmed
Gold has broken below the 4018–4033 support and the ascending trendline, confirming a bearish structure via a Bearish BOS. US CPI came in above expectations, and a stronger US dollar continues to weigh on gold.
1️⃣ BEARISH CONTINUATION (PRIORITY)
➤ 4018–4033 (H1 Resistance + FVG) Former support
AT 3,910 — AND 3,973 IS THE DOOR Leo | Friday 13 Nov 2026 | ~05:45 UTC
---
I. WHERE PRICE STANDS
The chart's last closed candle sits at 3,910.04, with roughly 4 minutes 20 seconds left on the live one. That number matters because it's parked right between the two zones the market has been fighting over all week.
Read left to r
XAU/USD | Gold Breaks Below $4030! Is $4000 the Next Target?By analyzing the #Gold chart on the 1H timeframe, we can see that buyers failed to break through the $4130 – $4145 bearish order block. Instead, sellers regained control and pushed Gold sharply lower, breaking below $4100, $4085 , and even the $4030 – $4050 demand zone we highlighted earlier. P
XAUUSD /GOLDGold is showing strong bearish momentum after facing repeated rejection from higher resistance levels. Recent price action indicates that sellers are gaining control, with the market breaking below the ascending trendline and shifting towards a weaker short-term structure.
The failure to sustain ab
XAUUSD H1 TECHNICAL ANALYSIS The chart shows a clear transition from consolidation → breakout → bullish recovery → rejection → bearish continuation. Price is currently trading around 3,931, with the market facing an important resistance zone near 3,950–3,958.
🕯️ Candle-by-Candle Price Action
1. Initial Sell-Off The left side of
See all futures ideas
EURUSD Breakout and Potential Retrace!Hey Traders, in today trading session we are monitoring EURUSD for a selling opportunity around 1.11500 zone, EURUSD was trading in an uptrend and successfully managed to break it out. Currently is in a correction phase in which it is approaching the retrace area at 1.11500 support and resistance ar
From Testing the Floor EURUSD’s to Challenging the CeilingHello traders! Here’s my technical outlook based on the current EURUSD (3H) chart structure. EURUSD previously started to decline under the Trend Line and tested the Buyer Zone. Price then bounced from support, showing signs of buyers defending the area.Currently, EURUSD is trading below the 1.1170
EUR/USD - Breakout Pattern (12.11.2026)Setup Overview
EUR/USD has broken below the lower boundary of its descending channel on the 4H timeframe, indicating increasing bearish pressure. Price is currently trading below the broken trendline. A potential retest followed by bearish rejection could provide an opportunity for further downsid
EURUSD - Daily Range - Model 1 - Thursday Reversal Hi Friends, New CLS Range has been created and Im looking for Long Model 1 trade setup. As always after the manipulation in to the Key Level, below the CLS range and reaction, we need to see a confirmation switch from the manipulation phase - CIOD (change in order flow) in the the expansion.
⏳ S
GBPUSD – Bearish Channel Breakdown & Downside Continuation Setup📊 GBPUSD – Bearish Channel Breakdown & Downside Continuation Setup
🔍 Market Overview
GBPUSD is showing signs of bearish momentum after facing rejection near the 1.3466–1.3494 resistance zone on the 4H timeframe. Following a strong recovery within an ascending channel, price failed to sustain its
USDCHF - BEARISH REJECTION AT STRUCTURE
USDCHF is testing a key horizontal resistance within a descending 🔺. Price has reclaimed the upper trendline, yet recent exhaustion shows bearish exhaustion at this pivot. Previous tests confirm the overhead supply zone acts as a firm ceiling for the current recovery attempt.
The market now faces
DeGRAM | USDJPY — Bulls Are Running Into a Major Barrier📊 Technical Analysis
● USDJPY is moving inside a rising wedge, with both resistance and support trending upward as price approaches the upper boundary.
● Price is testing the major resistance line near the recent highs, while the rising support line remains the key level below.
● The projected path
EURUSD: Share Your Opinion...Can This Move Happen?EURUSD: Share Your Opinion...Can This Move Happen?
Over the past two weeks, EURUSD has created several clear and bearish positions. The price made a clear close below the structure as you can see and moved back up.
Also yesterday gold fell because of the speculations that the FED may raise intere
GBPUSD: Sellers Are Setting the Next MoveGBPUSD is trading around 1.3256 , and recent price action suggests that buyers are gradually losing ground. Recovery attempts are becoming weaker, while selling pressure continues to build, reinforcing the SHORT-TERM BEARISH outlook.
From a fundamental perspective, higher-than-expected US infla
GBPCHF — 4H Price Action Analysis📊 Market Structure
GBPCHF on the 4H timeframe is approaching a key resistance area around 1.1065–1.1092 after a strong bullish recovery from the lower demand region. Price has pushed higher through several previous candles, but the current position shows signs of hesitation as price reaches the mar
See all forex ideas
Trade directly on Supercharts through our supported, fully-verified, and user-reviewed brokers.