NASDAQ 100 | ABCD Breakout & Midterm Q4 SeasonalityThe US Tech 100 has broken out to fresh all-time highs, and the daily chart now shows three things lining up: a completed ABCD continuation structure, a confirmed hold above the Point B swing high, and a clean bullish Bill Williams Alligator. Seasonality also favors the bulls going into the US midte
Where the world does markets
Join 100 million traders and investors taking the future into their own hands.
Get started for free$0 forever, no credit card needed

Supercharged
Supercharts

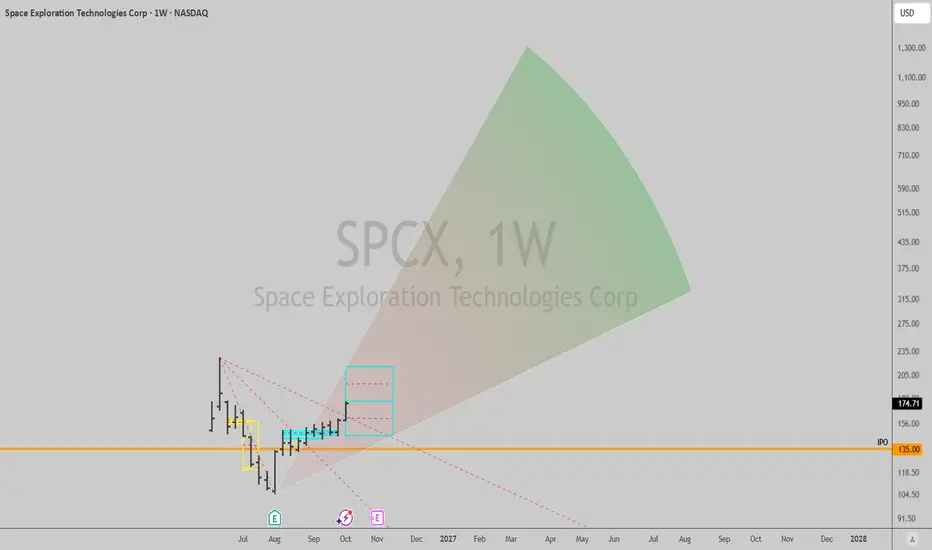
SPCX: weekly uptrend signal firedSpaceX triggered a weekly uptrend this week, trading through 173.44 after the post-IPO flush into August and a few weeks of basing just above the 135 IPO price. Back in August, right after its first earnings report, there wasn't enough history to read a trend on this chart at all. Now there is, and
$AMAT Forming a Possible Cup with Handle Pattern?AI Chip-Production Opportunity
Applied Materials operates in the critical AI chip-production market alongside NYSE:TSM , NASDAQ:ASML , and $LRCX. These companies appear well positioned for potential growth over the coming months and years. From a technical perspective, AMAT’s chart setup looks pa
Bitcoin Price Forecast 2026 - 2027 - 2028🅱️ Bitcoin (BTCUSD): Wave Y-(c) Developing — 126K, 144K, 168K & 198K Levels
CRYPTO:BTCUSD continues to present a potentially incomplete W-X-Y corrective construct at the daily degree, with the current advance being interpreted as the nascent development of the terminal subwave of Y .
The de
Bitcoin Bulls Take Charge – $110,670 in the Crosshairs
Bitcoin’s daily chart has shifted from the earlier downtrend into an uptrend. Buyers now control the broader move, with price holding above the rising trendline and both moving averages.
📊 Technical analysis
Your cup and handle supports further upside, with price at $86,125 above the 20-day MA a
What Is a Company Worth If It Owns None of Its Products?Plexus (NASDAQ: PLXS) builds medical devices, semiconductor equipment, and defense electronics, yet owns none of them. Its customers design the products and hold the intellectual property. That single fact explains the stock better than any chart. A widely circulated analysis argued that Plexus's fi
$NVDA: Trading the AI Compute Momentum
NASDAQ:NVDA remains one of my preferred setups when looking at the AI compute and semiconductor space.
The bigger catalyst is still AI infrastructure spending. Demand for GPUs, data-center expansion, and the broader buildout of AI compute continue to support the longer-term narrative. But fo
Can Anthropic afford to wait? Rising bond yields have made the market more uncertain, but Anthropic still has reasons to go ahead with its IPO.
Higher borrowing costs can weigh on stock valuations and make investors less willing to pay high prices for new listings. But waiting does not guarantee better conditions. Interest rat
Fed Chasing after 2-Year Yields May Result in Additional UpsideWhen the Fed starts chasing after the 2-Year treasury yield with the Federal Funds Rate, it usually chases it approximately 1.00% to 3.00% higher.
Looking at the 7 times in the past when this occurred, 5 of those times resulted in the 2-Year yield continuing its ascent. 2 of those times, in 1996 an
Gold W41: Softer Jobs Offer Relief, but the Downtrend Remains# Gold W41: Softer Jobs Offer Relief, but the Downtrend Remains
Gold opened Monday, October 5, with a small bounce after September US hiring came in softer than expected and prior months were revised downward. On the surface, that looks like a reason to turn constructive: lower hiring reduces press
See all editors' picks ideas
TASC 2026.10 A Low-Risk ETF-Trading Strategy█ OVERVIEW
This script implements concepts from a short-term ETF investment strategy outlined by Markos Katsanos in the article "Selecting Strong ETFs While Avoiding Sharp Overbought Reversals" from the October 2026 edition of TASC Traders' Tips . The strategy analyzes Katsanos' custom relative s
Buyers & Sellers Profile + Dynamic S/R (Zeiierman)█ Overview
Buyers & Sellers Profile + Dynamic S/R (Zeiierman) is a volume-profile and market-structure indicator designed to combine a large rolling Buyers/Sellers Volume Profile with dynamically generated support and resistance levels.
Instead of treating the volume profile and swing structure
Vol-Control Fund PositioningThe investors who sell because nothing happened
In 2017 the American stock market was so calm that a whole class of institutional portfolios held more equities than their own capital, simply because the rules they follow told them to. Reconstructed with the model behind this indicator, their estim
RedK Multi-Modal TrailingStop (RedK MMTStop)█ RedK MMTStop - Release Notes
Introduction & background
RedK MMTStop is a Multi-Modal Trailing Stop indicator - Let's quickly explore the "trailing stop" concept first as a refresher - then explain what a multi-modal trailing stop indicator does.
A "Trailing Stop" is what helps traders avoi
Trend Target Ribbon [BOSWaves]Trend Target Ribbon - ALMA Conviction Trend Detection with Integrated Structure-Based Position Planning and R-Multiple Target Tracking
Overview
Trend Target Ribbon is an ALMA-based trend identification system that combines slope-normalized momentum confirmation with standard deviation band
Wyckoff [theUltimator5]This indicator was designed to be a comprehensive, intuitive, overly engineered algorithm that plots Wyckoff accumulation and distribution patterns on the chart as they arise. It shows the current status of the regime on a side panel, while also overlaying the accumulation or distribution schematic
XeL OnlineRecursionXeL OnlineRecursion is a Pine Script library for online and streaming statistical estimation on continuous numerical and financial data.
The library is designed around recursive statistical populations whose retained state is updated observation by observation. Most recursive components use consta
Dual-Phase Reversal by DGTDual-Phase Reversal • Exhaustion, Pivots & Pressure
Dual-Phase Reversal (DPR) is a two-phase market exhaustion framework that tracks directional momentum through Momentum Exhaustion and Terminal Exhaustion . It combines sequential price conditions, Momentum Shift initiation, phase qualificatio
Zeiierman Trend Pressure (Zeiierman)█ Overview
Zeiierman Trend Pressure (Zeiierman) is a multi-layer trend pressure and exhaustion oscillator designed to visualize short-term momentum, persistent trend structure, directional pressure, and exhaustion states within a normalized 0 to -100 range.
Instead of relying on a single osci
Volume Delta Footprint Map (Zeiierman)█ Overview
Volume Delta Footprint Map (Zeiierman) is a lower-timeframe volume delta mapping indicator that visualizes where buying and selling pressure develops across both price and time.
The indicator uses lower-timeframe data to estimate the buying and selling activity occurring inside each
See all indicators and strategies
Community trends
NVDA Price Action | Rising Trendline Faces 240 Resistance🔹 NVDA remains within a broader rising price structure, with price respecting the ascending trendline while forming higher highs and higher lows. The latest move has pushed price toward the 240 resistance area, where sellers could remain active after the recent rejection. The highlighted 210–215 liq
ROCKET LAB H&S pattern calls for another -50% crash.Last time we had a look at Rocket Lab (RKLB), we gave a strong Sell Signal (June 08, see chart below) that easily hit our $85.50 Target:
Now that the Channel Up broke to the downside, the invalidation of that pattern takes us to the larger time-frames and more specifically the 1W chart. This c
$NVDA: Trading the AI Compute Momentum
NASDAQ:NVDA remains one of my preferred setups when looking at the AI compute and semiconductor space.
The bigger catalyst is still AI infrastructure spending. Demand for GPUs, data-center expansion, and the broader buildout of AI compute continue to support the longer-term narrative. But fo
Microsoft - This company is just printing!💻Microsoft ( NASDAQ:MSFT ) will soon create new highs again:
🔎Analysis summary:
Microsoft is now trading at the same price where is was trading about 12 months ago. In the meantime however, Microsoft gave us some major textbook swingtrading opportunities. With all this bullish momentum, Micro
HYFT - Can $1 Hold the Line?MindWalk Holdings Corp. NASDAQ:HYFT has gone through a major shift in market structure after spending years under bearish pressure.
Now, the stock is approaching an important area that could help determine whether the longer-term recovery remains intact.👀
📊Technical Outlook
HYFT was previous
SPCX: weekly uptrend signal firedSpaceX triggered a weekly uptrend this week, trading through 173.44 after the post-IPO flush into August and a few weeks of basing just above the 135 IPO price. Back in August, right after its first earnings report, there wasn't enough history to read a trend on this chart at all. Now there is, and
$AMAT Forming a Possible Cup with Handle Pattern?AI Chip-Production Opportunity
Applied Materials operates in the critical AI chip-production market alongside NYSE:TSM , NASDAQ:ASML , and $LRCX. These companies appear well positioned for potential growth over the coming months and years. From a technical perspective, AMAT’s chart setup looks pa
MSFT: All-Time High in SightMicrosoft’s daily chart shows a strong recovery, with higher lows and a fresh push above the recent consolidation. At the displayed regular-session price of $525.18, buyers remain in control, with the $555.23 all-time high as the next major test.
The $510–$520 area is the first zone to watch on a p
KMI – 10% Upside Potential
The reasons:
1. The chart clearly shows that this is the second Flag formation developing within the current uptrend. The first was a larger formation, which I labeled (a, b).
2. The second Flag developed from the breakout of the first Flag. The mid-January rally was
AAPL 30m: Holding 328.50 Support | Target 338.50 Next
`Apple Inc (AAPL) is trading in a range on the 30m timeframe.
Support: 328.50 - Holding strong
Resistance: 338.50 - Immediate target
Major Resistance: 344.00
Apple is consolidating after a sharp drop from 344.00. A bounce from 328.50 support could push price back to 338.50 target.
Break above 33
See all stocks ideas
Today
AEHRAehr Test Systems
Actual
—
Estimate
—
Today
CMTLComtech Telecommunications Corp.
Actual
—
Estimate
−0.43
USD
Today
MAYSJ. W. Mays, Inc.
Actual
—
Estimate
—
Today
VFSVinFast Auto Ltd.
Actual
—
Estimate
−0.27
USD
Today
CHRNChronoScale Holdings Corporation
Actual
—
Estimate
−0.09
USD
Today
APLDApplied Digital Corporation
Actual
—
Estimate
−0.30
USD
Today
RELLRichardson Electronics, Ltd.
Actual
—
Estimate
0.09
USD
Today
RGPResources Connection, Inc.
Actual
—
Estimate
−0.17
USD
See more events
Community trends
Bitcoin Price Update – Clean & Clear ExplanationBTCUSDT is showing a clear bearish reaction from the 86,000–86,800 resistance/supply zone, where price previously faced strong rejection the recent move back below 85,600–85,900 suggests that buyers are losing momentum and sellers are gaining control.
From a market-structure perspective, this react
Bitcoin Starts the Week Higher — Is This Rally a Bull Trap?Bitcoin ( BINANCE:BTCUSDT ) started the new week with a bullish move of more than 2%, but the recovery has developed with relatively low trading volume.
BTC is still trading inside an Expanding Ending Diagonal, which also resembles an Ascending Broadening Wedge Pattern from a classical technical an
Reading Price With Open InterestPrice tells you where the market moved. Open interest can help explain whether traders were adding or removing derivative exposure while that move happened.
The useful part is not whether open interest is simply “high” or “low.” It is how it changes relative to price.
Suppose CRYPTOCAP:BTC ralli
BTCUSDT Strengthens After the Range Bounce — 88,000 AwaitsHello traders! Here’s my technical outlook based on the current BTCUSDT (3H) chart structure. BTCUSDT previously traded inside a descending structure before breaking higher and shifting bullish. Price then formed a range near the Buyer Zone, tested higher levels, and bounced from support. Currently,
Ethereum: Buyers Step In as the Next Bullish Wave BeginsEthereum: Buyers Step In as the Next Bullish Wave Begins
Over the past week, Ethereum tested the 2350 support area and bounced back aggressively.
This is likely to be of great importance considering that buyers increased in number. The price rose by almost +20% in just 7 days, which is not so nor
BTCUSDT: Double Rejection Keeps 80.7K in FocusBitcoin is struggling around the $85,000–$86,300 resistance zone after two failed attempts to extend above the recent highs. Buyers are still holding price above the fast EMA near $85,100, but momentum is clearly slowing inside this area.
The key signal would be a clean H4 break back below $85,000.
ADA tries to reclaim crucial level#ADA / USDT
ADA is making a strong attempt to reclaim a key support level, with price action showing signs of renewed strength.
A sustained acceptance above resistance would increase the probability of a continuation move and potentially mark the beginning of the next leg higher for Cardano 🚀
Ke
$BTC Loses Trendline, $83K Next?CRYPTOCAP:BTC Breakdown Done🚨
After multiple attempts at $86.5K–$86.8K, BTC is now losing the ascending trendline.
If the breakdown confirms, we could see a move toward $83K first, with $80K coming into play after that.
Is this the start of a deeper pullback?
CRYPTOCAP:BTC BINANCE:BTCUSDT BI
BTC | Second Rejection From The Same Resistance - Possible ShortBTC has rejected the resistance zone again, and the week opened with price turning straight off that same ceiling.
🟠 Why This Level Matters:
The resistance near 86,400 has now capped price twice. Each rejection leaves lower closes and shifts momentum back to the downside. The next break point sit
HYPEUSDT - The correction is over. Ready for the rally BINANCE:HYPEUSDT.P is consolidating near resistance formed within the trading range. The market is bullish, as is the altcoin’s trend, and I expect the rally to continue.
Bitcoin maintains its bullish structure and continues to consolidate with preconditions for further growth. A strong Bitcoi
See all crypto ideas
XAUUSD 4H | Institutional Liquidity Mapping & Price Action StudyXAUUSD 4H | Educational Fundamental & Technical Analysis
Oil is under strong selling pressure, which can reduce inflation pressure and support expectations for softer rates.
This environment can support Gold buying, while geopolitical tensions involving the U.S., Iran, Russia–Ukraine and the Midd
GOLD : Buyers Defend $4,120 as Breakout Setup BuildsGOLD: Buyers Defend $4,120 as Breakout Setup Builds
Gold continues to consolidate inside an expanding pattern following the sharp sell-off from the $4,300 area.
Price recently tested the lower boundary around $4,120–$4,130 and has started to recover, keeping the bullish breakout scenario alive.
XAUUSD 1D | SMC Market Structure Liquidity & Trendline EducationXAUUSD 1D — Professional Candle-by-Candle Education
This chart explains why each candle can create buying or selling pressure, using SMC concepts such as liquidity, market structure, BOS, CHoCH, FVG, Order Blocks and the descending trendline. A candle should never be judged alone; its location and
XAUUSD — Liquidity Sweep + CHoCH + Trendline Break + Order Block
This analysis presents a complete SMC liquidity-based reversal model using liquidity sweep, market structure, trendline behavior, support/resistance, and Order Block confirmation.
The market initially remains under a descending trendline, showing that sellers are controlling the broader move. As p
THE KOG REPORT - UpdateEnd of day update from us here at KOG:
A decent start to the week with gold giving us the RIP from the RB and then a lovely retracement trade during the London session. After that, it has continued the move on the chart but very laboriously.
The issue I have here is the lack of volume to move t
XAU/USD | Gold Back Under Pressure, Bearish Bias For This Week!By analyzing the #Gold chart on the 4H timeframe, we can see that after the previous analysis, Gold extended its decline toward $4125 , then recovered toward $4170 before sellers stepped in again. Price is currently trading around $4132 .
Based on the current price structure, my bias for this
GOLD New Range Detected , Best Places For Buy&Sell Spotted !Here Is My 30 Mins Gold Chart , we have a side ways now the price stay in this range since last week and here is the best places for buy and sell cleared , the price created a new support around 4130.00 to 4140.00 and the price touched this area many times and bounced very good from it si it will be
XAUUSD Long: Bounce From 4,100 Puts 4,250 Back in FocusHello traders! Here’s my technical outlook based on the current XAUUSD (4H) chart structure. XAUUSD previously traded inside an ascending channel before breaking higher and later forming a descending channel. Price then tested the Demand Zone near 4,100 and bounced.
Currently, XAUUSD is trading bel
Gold (XAUUSD) — Higher Time Frame Bearish OutlookGold (XAUUSD) — Higher Time Frame Bearish Outlook
Gold is currently showing a bearish higher-time-frame structure, with price respecting lower highs and continued downside displacement after rejection from the upper supply region. The current price action suggests that rallies into marked resistanc
See all futures ideas
GBPUSD Weekly CLS - Model 1Hi Friends, New CLS Range has been created and Im looking for Long Model 1 trade setup. As always after the manipulation in to the Key Level, below the CLS range and reaction, we need to see a confirmation switch from the manipulation phase - CIOD (change in order flow) in the the expansion.
⏳ S
GBP/USD - H1 falling wedge breakoutGBP/USD displays a well-defined falling wedge pattern on the 1-hour timeframe, confirming a decisive shift in market structure as price breaks above descending resistance near 1.3240. The lower demand zone between 1.3170 and 1.3180 continues to hold firm as strong structural support, establishing a
EURUSD: A False Break at 1.1200 Could Trigger a RecoveryHello everyone, here is my breakdown of the current EURUSD setup.
Market Analysis
EURUSD previously formed a Rounding Top and traded inside a wedge structure before breaking lower. Price then tested the Support Zone with a fake breakout and rebounded, showing signs of buyers stepping in.
Current
AUD/USD - Channel Breakout (06.10.2026)AUDUSD has confirmed a strong channel breakout pattern after breaking above the descending upper trendline with a strong candle confirmation in H1. Price has been in a clear downtrend, yet buyers have now regained control directly above the 0.6930 demand barrier. This decisive breakout clears path t
GBPUSD is Nearing a Strong Resistance Area!Hey Traders, in today's trading session we are monitoring GBPUSD for a selling opportunity around 1.32700 zone, GBPUSD is trading in a downtrend and currently is in a correction phase in which it is approaching the trend at 1.32700 support and resistance area.
Trade safe, Joe.
DeGRAM | GBPJPY — 208.00 Support Keeps the Upside in Play📊 Technical Analysis
● GBPJPY is holding above the 208.00–208.20 support zone after the latest pullback, while price remains positioned for another attempt at the 209.80–210.10 resistance area.
● The pair has already broken above the short-term descending structure, turning the current consolidatio
EURUSD 30M: Bullish Reversal Setup Building From SupportEURUSD is showing a potential bullish recovery structure on the 30-minute chart after a prolonged decline. Price recently found support around the 1.1170 area and has started recovering from the recent low, indicating that buyers are attempting to regain short-term control.
The chart shows price co
EURUSD | Bullish Triangle Breakout & Upside Continuation SetupEURUSD | Bullish Triangle Breakout & Upside Continuation Setup
Fundamental View
EURUSD is attempting to build a bullish rebound as expectations for an immediate Federal Reserve rate hike have softened following weaker U.S. employment data. Fed officials have also indicated that there is no urgency
GBPUSD 2H: Bullish Breakout Retest & Continuation PotentialGBPUSD 2H: Bullish Breakout Retest & Continuation Potential
GBPUSD (FX_IDC:GBPUSD) has broken above its primary descending trendline channel on the 2H timeframe and is currently holding inside the key support area (1.3200 - 1.3250). Price is consolidating above this demand base following the breakou
Euro Slides From 1.1290 as Sellers Keep the Downtrend IntactHello traders! Here’s my technical outlook based on the current EURUSD (4H) chart structure. EURUSD previously traded inside a range before breaking higher and later forming a descending structure after turning around from the highs. Price then tested the Seller Zone and was rejected, continuing low
See all forex ideas
Trade directly on Supercharts through our supported, fully-verified, and user-reviewed brokers.