ADOBE (Photoshop & Illustrator): A New Technical Era (2026)I named the title "ADOBE (Photoshop & Illustrator): A New Technical Era (2026)" because we have multiple confluences on multiple timeframes occurring synonymously.
Monthly:
Long-term diagonal TL from 1987, hit multiple times. Now the price has given signs of life at that TL in 2026.
A-B-C complet
Where the world does markets
Join 100 million traders and investors taking the future into their own hands.
Get started for free$0 forever, no credit card needed

Supercharged
Supercharts

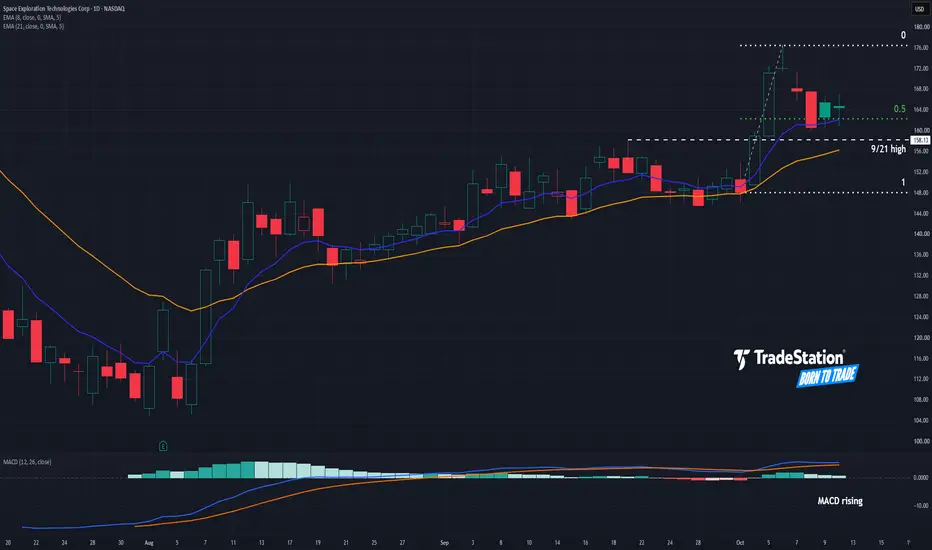
SpaceX Steadies After SurgeSpace Exploration Technologies jumped earlier this month, and some traders could think the ascent will continue.
The first pattern on today’s chart is the October 1-6 rally. The space-launch company has pulled back to hold a 50 percent retracement of that move, which may confirm the direction of th
USDCAD H1 | Bullish Bounce Off Key SupportMomentum: Bullish
Price is currently above the ichimoku cloud.
Buy entry: 1.42291
- Overlap support
- 78.6% Fib retracement
- 100% Fib projection
Stop Loss: 1.42019
- Swing low support
Take Profit: 1.42851
- Swing high resistance
High Risk Investment Warning
Stratos Markets Limited (fxcm.com/uk
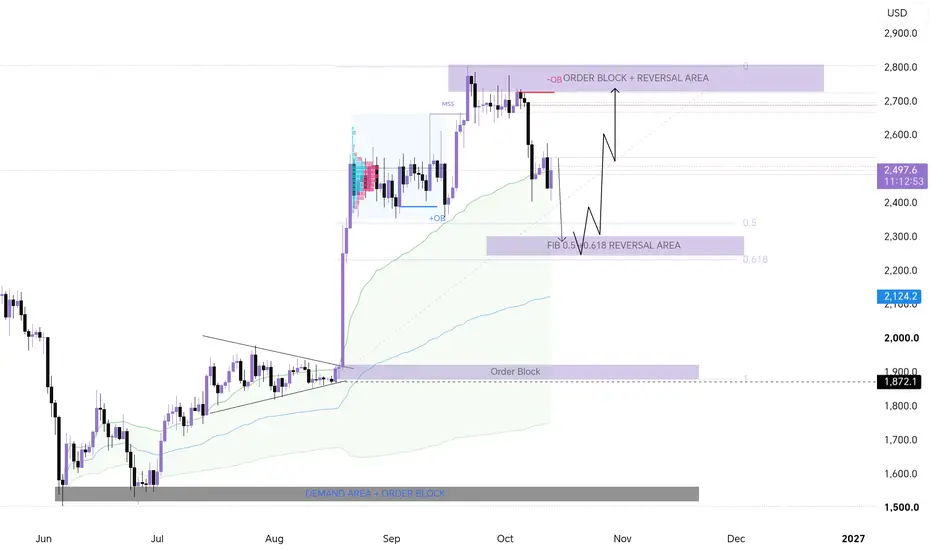
Ethereum: Rising Channel Keeps $3,000 in FocusEthereum price action continues to trade within a local ascending channel, maintaining a sequence of higher lows as buyers defend key support. The channel's lower boundary, situated around $2,400, remains an important technical level, with recent price action respecting this region and preserving th
Elliott Wave Analysis – XAUUSD | October 13, 2026
1. Daily Timeframe (D1)
D1 momentum has reached the overbought zone and is now preparing to reverse downward. If today's daily candle continues to maintain bearish momentum, the market could enter a corrective decline lasting approximately 3–5 trading days.
At this stage, as we expect wave (Y) t
Gold Hints at Quiet Accumulation as Bulls Seek DipsGold made a mild attempt to reverse its trend and break above its bearish trendline, although falling volumes suggest the move lacks strong bullish conviction for now. However, the sharp rejection of $4,100 ahead of the bounce suggests quiet accumulation may be underway, with bulls potentially seeki
Copper at a Record, but the Tariff Trade Is FadingOn 9 September 2026, front-month LME copper set an all-time high of $14,940 per tonne. COMEX Copper Futures followed with its own record of $6.9285 per lb on 22 September. Both have since pulled back.
The force behind the rally was not a shortage. Traders were pricing in an expected US tariff on i
Stocks Are Near Records. Can Q3 Earnings Boost the Rally?Wall Street is betting on profits.
The S&P 500 SP:SPX is gravitating toward another all-time high. The Nasdaq NASDAQ:IXIC has been setting records, technology stocks remain in demand and investors are heading into earnings season (ref: Earnings calendar ) with plenty of reasons to be optimi
Gold Price - XAU/USD Q4 2026: Can the Support Drive a Recovery?In Q3 2026, gold ETFs and central banks together bought nearly 296 tonnes of gold, one of the strongest quarters of buying in 23 years of data.
Yet the average gold price for the quarter fell 5.4% , the steepest drop of any quarter with total demand above 150 tonnes since 2003.
This article w
Heading toward strong resistance?AUD/USD is rising toward the resistance level, which is an overlap resistance that aligns with the 127.2% Fibonacci extension and the 61.8% Fibonacci projection and could reverse from this level to our take profit.
Entry: 0.7004
Why we like it:
There is an overlap resistance level that aligns with
See all editors' picks ideas
RedK Indicator Amplifier (RedK i-Amp)🟩 What is RedK i-Amp?
-------------------------------
RedK i-Amp is not an indicator in itself - it's a "wrapper" utility that "amplifies" another "source" indicator by improving its visual and alerting capabilities.
RedK i-Amp hooks to another indicator's plot and enables the addition of the fol
TASC 2026.10 A Low-Risk ETF-Trading Strategy█ OVERVIEW
This script implements concepts from a short-term ETF investment strategy outlined by Markos Katsanos in the article "Selecting Strong ETFs While Avoiding Sharp Overbought Reversals" from the October 2026 edition of TASC Traders' Tips . The strategy analyzes Katsanos' custom relative s
Buyers & Sellers Profile + Dynamic S/R (Zeiierman)█ Overview
Buyers & Sellers Profile + Dynamic S/R (Zeiierman) is a volume-profile and market-structure indicator designed to combine a large rolling Buyers/Sellers Volume Profile with dynamically generated support and resistance levels.
Instead of treating the volume profile and swing structure
Vol-Control Fund PositioningThe investors who sell because nothing happened
In 2017 the American stock market was so calm that a whole class of institutional portfolios held more equities than their own capital, simply because the rules they follow told them to. Reconstructed with the model behind this indicator, their estim
RedK Multi-Modal TrailingStop (RedK MMTStop)█ RedK MMTStop - Release Notes
Introduction & background
RedK MMTStop is a Multi-Modal Trailing Stop indicator - Let's quickly explore the "trailing stop" concept first as a refresher - then explain what a multi-modal trailing stop indicator does.
A "Trailing Stop" is what helps traders avoi
Trend Target Ribbon [BOSWaves]Trend Target Ribbon - ALMA Conviction Trend Detection with Integrated Structure-Based Position Planning and R-Multiple Target Tracking
Overview
Trend Target Ribbon is an ALMA-based trend identification system that combines slope-normalized momentum confirmation with standard deviation band
Wyckoff [theUltimator5]This indicator was designed to be a comprehensive, intuitive, overly engineered algorithm that plots Wyckoff accumulation and distribution patterns on the chart as they arise. It shows the current status of the regime on a side panel, while also overlaying the accumulation or distribution schematic
XeL OnlineRecursionXeL OnlineRecursion is a Pine Script library for online and streaming statistical estimation on continuous numerical and financial data.
The library is designed around recursive statistical populations whose retained state is updated observation by observation. Most recursive components use consta
Dual-Phase Reversal by DGTDual-Phase Reversal • Exhaustion, Pivots & Pressure
Dual-Phase Reversal (DPR) is a two-phase market exhaustion framework that tracks directional momentum through Momentum Exhaustion and Terminal Exhaustion . It combines sequential price conditions, Momentum Shift initiation, phase qualificatio
Zeiierman Trend Pressure (Zeiierman)█ Overview
Zeiierman Trend Pressure (Zeiierman) is a multi-layer trend pressure and exhaustion oscillator designed to visualize short-term momentum, persistent trend structure, directional pressure, and exhaustion states within a normalized 0 to -100 range.
Instead of relying on a single osci
See all indicators and strategies
Community trends
TESLA 3 Technological Eras, 3 Explosive Rallies. Is $2000 Next?Tesla (TSLA) has been trading within a massive Channel Up ever since its June 2010 IPO and despite the extreme volatility over the past decade, its price action continues to respect this impressive multi-year structure.
What makes this chart particularly interesting, however, isn't just the technic
SpaceX Steadies After SurgeSpace Exploration Technologies jumped earlier this month, and some traders could think the ascent will continue.
The first pattern on today’s chart is the October 1-6 rally. The space-launch company has pulled back to hold a 50 percent retracement of that move, which may confirm the direction of th
United Health - This stock will double pretty soon!🚨United Health ( NYSE:UNH ) is heading for another bullrun:
🔎Analysis summary:
After retesting major support back in 2025, United Health already rallied about +50%. But since structure is so clear on this chart, this was just the beginning of the next bullish cycle. Following the rising chann
Nvidia (NVDA): Bearish conditions intensifying vs bear-marketThe same chart conditions have been present for more than five months. A long-term bearish chart structure is developing on NVDA. There was another failed attempt at a bullish resumption. We have another rejection as a shy higher high, a double-top. Trading volume is low and dropping which supports
NVIDIA (Nvda) Outlook | Sell-off Or Buying Opportunity💻 15-Minute Technical Analysis | Globus Capitas
NVIDIA has faced fresh selling pressure, with price slipping below the key $224.40 POC (Point of Control) after trading in a relatively tight range. The next move depends on whether buyers can reclaim this level or sellers extend the decline.
🔑 KEY L
MCD: Asymmetric Long SetupMCD: Asymmetric Long Setup as Primary Correction Approaches Terminal Support
Elliott Wave
Weekly Chart: MCD completed a five-wave impulse from the 2020 low into the March 2026 peak of $341.75. Wave 3 was the extended wave, satisfying the rule that it cannot be the shortest. Wave 4 remained stri
Franklin Electric: volume/price is not unit growthFranklin Electric’s second-quarter sales bridge answers where the reported increase came from. It does not isolate how many additional units were sold.
The July 28 release shows consolidated sales rising from $587.4 million to $622.9 million. Its rounded bridge allocates the $35.5 million increase
$MU: $1,000 Reclaim or $900 Reload? | 6th Swing Update🔘 NASDAQ:MU has started pulling back after failing to break and hold above $1,100. The double resistance from the Daily Gap and VAH is clearly taking effect.
Fortunately, if you look back at my previous updates, you’ll see that I had already been flagging the risks and leaning bearish earlier th
See all stocks ideas
Today
BACBank of America Corporation
Actual
—
Estimate
1.10
USD
Today
FASTFastenal Company
Actual
—
Estimate
0.34
USD
Today
SOTKSono-Tek Corporation
Actual
—
Estimate
0.04
USD
Today
STTState Street Corporation
Actual
—
Estimate
3.68
USD
Today
MSMorgan Stanley
Actual
—
Estimate
2.93
USD
Today
AEHRAehr Test Systems
Actual
—
Estimate
—
Today
PGRProgressive Corporation (The)
Actual
—
Estimate
4.35
USD
Today
NTRPNextTrip, Inc.
Actual
—
Estimate
−0.14
USD
See more events
Community trends
Repeated Supply Rejections Put Bitcoin’s Local Support in FocusHello traders! Here’s my technical outlook based on the current BTCUSDT (1H) chart structure. BTCUSDT previously turned around from the highs and formed a descending structure under the Resistance Line. Price then tested the Seller Zone multiple times with breakouts and was rejected. Currently, BTCU
BTCUSD Bearish Reversal – Targets at $82,009 and $80,360
Bitcoin is showing bearish momentum after facing strong rejection from the $84,400 resistance zone and breaking below the ascending trendline. The price has already experienced a sharp decline from the $86,800 area and recently bounced from the $80,360 low.
Currently, BTCUSD is recovering toward
ETHUSD – H4 – Support Zone & Bullish Recovery SetupETHUSD – H4 – Support Zone & Bullish Recovery Setup
Key Levels
* Support Zone: 2,387–2,411
* 1st Resistance: 2,638
* 2nd Resistance: 2,727
Market Analysis: ETHUSD is trading near 2,512.79 after a strong bearish move. Price is showing a recovery from the recent low, but the overall structure rem
BTCUSDT 4H: Key Demand Zone Could Trigger the Next Leg HigherHi!
Market Outlook: Bullish Scenario
BTC is consolidating below the 100 SMA after printing a potential double top near the $87K region. Price is now approaching a key demand zone between $79K and $80K, which aligns with the lower boundary of the ascending channel.
I’m watching for a potential l
BTCUSDT Analysis | Liquidity Sweep, FVG & Key Selling ZonesMarket Structure: Bearish Correction | Key Support & Resistance | Potential Reversal Setup
Bitcoin is currently trading around the 83,500–83,600 region after a sharp bearish displacement from the 85,500–86,000 resistance area. The chart shows a change in market structure (CHoCH) followed by strong
ETHUSD ICT Order Block, Fibonacci OTE & Market Structure This analysis presents a potential bullish continuation setup using ICT market structure, order blocks, Fibonacci retracement, and dynamic support. Price previously formed a consolidation pattern before breaking upward with strong bullish displacement. After reaching the upper resistance region, the
How Order Size Affects ExecutionA market order does not guarantee one execution price. It tells the market to fill the requested position using the liquidity currently available, and the larger the order becomes, the more important that available liquidity becomes.
Suppose CRYPTOCAP:BTC is trading around $80,000 and the best as
BTCUSDT 4H: ICT Liquidity Sweep, MSS & Order Block AnalysisBTCUSDT 4H | Advanced ICT & Smart Money Concepts Analysis
1. Market Overview
This analysis examines Bitcoin (BTCUSDT) on the 4-hour timeframe using Inner Circle Trader (ICT) concepts and Smart Money Concepts (SMC). The objective is to understand liquidity distribution, market structure, potential
BITCOIN - Consolidation Amid a Bull Market CycleBINANCE:BTCUSDT.P maintains its medium-term bullish trend while forming a local countertrend correction, potentially setting the stage for consolidation ahead of a possible medium-term distribution phase
Various analytical services point to temporary market stagnation, while also indicating fr
ETHUSD Bearish SetupETHUSD Bearish Setup
Price is currently around 2,494, showing rejection from the 2,520–2,530 resistance area and weakness below the rising trendline. If bearish momentum continues, price could move toward the lower support zone.
🔹 Resistance: 2,520–2,530
🔹 Major Resistance: 2,580
🔸 Support: 2,420–2,
See all crypto ideas
GOLD - Bearish trend. Rebound from 4220 IC:XAUUSD maintains its bearish trend and is forming a bounce as part of my latest trading idea. The market remains within the 4,110–4,220 range. A reversal setup could trigger another decline.
A strong dollar, rising oil prices, an unstable fundamental backdrop, and anticipation of CPI data a
GOLD is Nearing a Strong Resistance Area!Hey Traders, in today's trading session we are monitoring XAUUSD for a selling opportunity around 4,210 zone, Gold is trading in a downtrend and currently is in a correction phase in which it is approaching the trend at 4,210 support and resistance area.
Trade safe, Joe.
GOLD Consolidation Bearish another Active momentumGold is facing renewed selling pressure after failing to sustain its recent recovery toward the 4,200 / 4,228 resistance zone.
Tecnically gold slipped from its one-week high as the US dollar remained strong. Investors are also positioning cautiously ahead of this week’s US CPI inflation report, fol
Gold Bullish Trend — Rebound from the Key Demand ZoneGold continues to maintain a bullish market structure, with price showing a potential rebound from the key demand zone around 4,050–4,100. This area represents an important support region where buyers may step in and support further upside movement. If bullish momentum continues and price confirms a
XAUUSD — KEY DECISION ZONE | BEARISH MARKET STRUCTUREXAUUSD — KEY DECISION ZONE | BEARISH MARKET STRUCTURE
Gold is approaching a critical support area, with the current price shown near 4,194. The overall chart structure remains bearish, with lower highs, bearish breaks of structure, and a descending trendline indicating continued selling pressure. H
XAUUSD 1D | Market Structure Liquidity & Key Levels AnalysisThis chart explains how Smart Money Concepts (SMC), liquidity, market structure, FVGs, Order Blocks and the bearish trendline work together. Every candle should be read according to its location, previous structure and reaction from important zones rather than in isolation.
Initial Bullish Structur
GOLD Price Update – Clean & Clear ExplanationGold is currently trading around 4,172, showing signs of bearish pressure after facing strong rejection from the critical reversal zone near 4,200–4,210.
The market has also broken below the previous support area around 4,180, which may now act as resistance if price attempts a recovery as long as
XAUUSD – Bullish Reversal & Upside Expansion Setup📊 XAUUSD – Bullish Reversal & Upside Expansion Setup
🔍 Market Overview
Gold is showing early signs of a potential bullish recovery after an extended corrective move within a descending channel on the 4H timeframe. Price is currently rebounding from the recent support region, with buyers attempti
GOLD New Range Detected, Best Buy&Sell Areas Spotted 1500 Pips Here Is My 30Mins Gold Chart , New Range just detected , we have 3 places for sell and 1 place for buy let me explain , the price closed last week very bullish and closed above 4180.00 which is a very good after 3 weeks , and with market opening the price touched our selling area that we sell from i
XAU/USD | Still stuck between the FVGs, further drop incoming?By analyzing the 4H chart of Gold we can see that it is still stuck in between the 2 FVGs, currently being traded at around 4190 level.
Gold dropped inside the 4H FVG but then bounced back up, reaching the psychological resistance 4200 level but it was rejected by it. Currently, I expect Gold to re
See all futures ideas
Bullish Trendline Support, Targeting 158.90USDJPY is maintaining a bullish structure on the 2-hour chart, supported by a rising trendline that has repeatedly helped the price recover from pullbacks. The market is currently testing the trendline support area around 157.80–158.00, making this a key zone to watch for a potential bullish rebound
EURUSD 4H: MSS + Order Block Setup ExplainedEURUSD 4H: Understanding the MSS + Order Block Entry Model
1. Market Overview — The Bigger Picture
EURUSD remains in a broader bearish structure on the 4-hour chart, characterized by a sequence of lower highs and lower lows. The recent price action shows consolidation near the lows following an ex
USDJPY is Nearing a Strong Support!Hey Traders, in today's trading session we are monitoring USDJPY for a buying opportunity around 157.600 zone, USDJPY is trading in an uptrend and currently is in a correction phase in which it is approaching the trend at 157.600 support and resistance area.
Trade safe, Joe.
The 1.1240 Ceiling Holds as EURUSD’s Downward Structure PersistsHello traders! Here’s my technical outlook based on the current EURUSD (2H) chart structure. EURUSD previously traded inside a range before starting to decline and forming a descending structure under the Resistance Line. Price then tested the Seller Zone with a fake breakout and was rejected. Curre
EURUSD: Unusual Price Action, Bullish Scenario Still AliveEURUSD: Unusual Price Action, Bullish Scenario Still Alive
Currently, EURUSD is in a very strange price development.
In my opinion, USD is still acting in a very strange way. Uncertainty regarding the US midterm elections, US debt, oil prices, etc., may further support USD weakness.
On the other
USDCHF: Bearish Trendline Breakdown?🔹 USDCHF price action shows that the pair has been trading within a broader bullish structure, supported by a rising trendline connecting previous higher lows. However, the recent rejection near the 0.8365–0.8370 resistance zone suggests that bullish momentum may be weakening. Price is currently con
GBPUSD Daily CLS Model 2 / H4 CLS Nested Model 1Hi Friends, New CLS Range has been created and Im looking for short Model 1 trade setup. As always after the manipulation in to the Key Level, below the CLS range and reaction, we need to see a confirmation switch from the manipulation phase - CIOD (change in order flow) in the the expansion.
⏳
EURUSD: 1.1220 Rejection Puts Sellers Back in the SpotlightHello everyone, here is my breakdown of the current EURUSD setup.
Market Analysis
EURUSD previously traded inside an upward channel before breaking lower into a wedge structure. Price then tested the Resistance Zone near 1.1220 and was rejected, confirming the bearish shift.
Currently, EURUSD is
EUR/USD: Strong Bearish PatternThe 📉EURUSD pair is currently showing clues of a bearish trend continuation.
The market consolidated within a symmetrical triangle pattern for the past week, but the support level was broken yesterday.
I anticipate a continuation of this trend. The next target is 1.1154.
EURUSD Bearish Continuation – Downside Target at Support EURUSD is trading below a descending trendline, indicating continued bearish pressure. Price is showing a short-term rebound, but resistance around 1.1215–1.1220 may limit further upside. If sellers regain control and the descending trendline holds, price could move lower toward the support zone at
See all forex ideas
Trade directly on Supercharts through our supported, fully-verified, and user-reviewed brokers.