The AI Boom Is Running on Borrowed Money. Should Traders Worry?The AI boom has found a new investor: The bond market.
The artificial intelligence boom has produced extraordinary revenue, record-breaking stock rallies and a seemingly endless appetite for Nvidia NASDAQ:NVDA chips. Now comes the bill.
SpaceX NASDAQ:SPCX is seeking $40 billion in financing
Where the world does markets
Join 100 million traders and investors taking the future into their own hands.
Get started for free$0 forever, no credit card needed

Supercharged
Supercharts

STX Building a Triangle Squeeze, Watching for BreakoutNASDAQ:STX continues to coil inside a multi-month symmetrical triangle, with higher lows pressing against a descending resistance trendline.
Price is currently trading just below the key breakout level near 866. The longer this compression persists, the greater the potential expansion move once pr
BTCUSD (Bitcoin) : Bearish Retest Setup Target $80,000 SupportExecutive Summary
Bitcoin (BTCUSD) has broken down below its ascending trendline support and local consolidated structure on the 4-hour time frame. Price action projects a corrective pullback toward the Fib retracement confluence zone before extending downward toward the major daily support level n
Short-Term Peak Range: 2654.48 ~ 2753.63
Hello,
Nice to meet you, fellow traders.
If you follow me, you can always receive new information quickly.
Have a great day today as well.
-------------------------------------
The volatility period lasts until October 7.
Therefore, it is important to observe the price range in which newly fo
USD/JPY builds a right shoulder - what breaks the neck?There is a head and shoulders forming on this chart, and the right shoulder is being built this week. It is not complete, and the level that would complete it is almost 200 points below where price is trading.
USD/JPY is 158.206 with the 09:00 UTC candle barely open. The pair has spent six sessions
NASDAQ 100 | ABCD Breakout & Midterm Q4 SeasonalityThe US Tech 100 has broken out to fresh all-time highs, and the daily chart now shows three things lining up: a completed ABCD continuation structure, a confirmed hold above the Point B swing high, and a clean bullish Bill Williams Alligator. Seasonality also favors the bulls going into the US midte
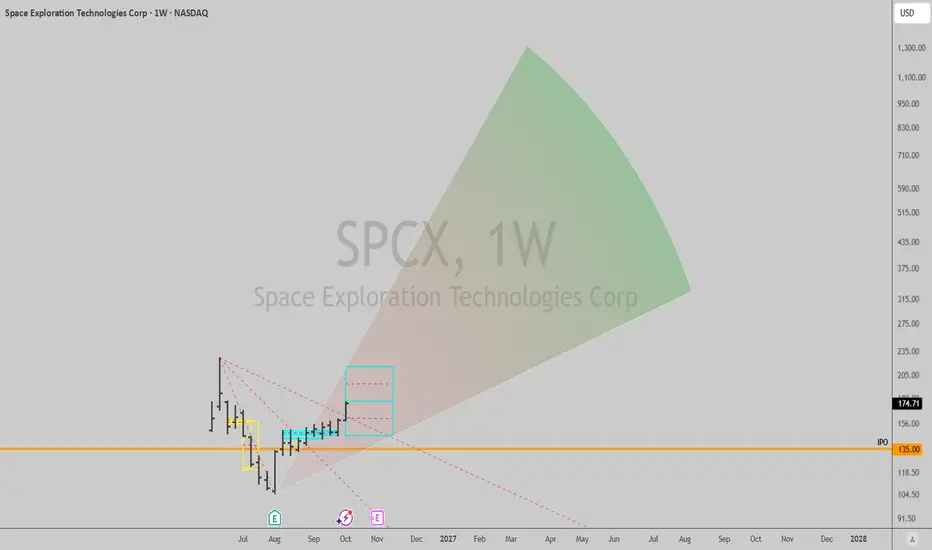
SPCX: weekly uptrend signal firedSpaceX triggered a weekly uptrend this week, trading through 173.44 after the post-IPO flush into August and a few weeks of basing just above the 135 IPO price. Back in August, right after its first earnings report, there wasn't enough history to read a trend on this chart at all. Now there is, and
$AMAT Forming a Possible Cup with Handle Pattern?AI Chip-Production Opportunity
Applied Materials operates in the critical AI chip-production market alongside NYSE:TSM , NASDAQ:ASML , and $LRCX. These companies appear well positioned for potential growth over the coming months and years. From a technical perspective, AMAT’s chart setup looks pa
Bitcoin Price Forecast 2026 - 2027 - 2028🅱️ Bitcoin (BTCUSD): Wave Y-(c) Developing — 126K, 144K, 168K & 198K Levels
CRYPTO:BTCUSD continues to present a potentially incomplete W-X-Y corrective construct at the daily degree, with the current advance being interpreted as the nascent development of the terminal subwave of Y .
The de
Bitcoin Bulls Take Charge – $110,670 in the Crosshairs
Bitcoin’s daily chart has shifted from the earlier downtrend into an uptrend. Buyers now control the broader move, with price holding above the rising trendline and both moving averages.
📊 Technical analysis
Your cup and handle supports further upside, with price at $86,125 above the 20-day MA a
See all editors' picks ideas
TASC 2026.10 A Low-Risk ETF-Trading Strategy█ OVERVIEW
This script implements concepts from a short-term ETF investment strategy outlined by Markos Katsanos in the article "Selecting Strong ETFs While Avoiding Sharp Overbought Reversals" from the October 2026 edition of TASC Traders' Tips . The strategy analyzes Katsanos' custom relative s
Buyers & Sellers Profile + Dynamic S/R (Zeiierman)█ Overview
Buyers & Sellers Profile + Dynamic S/R (Zeiierman) is a volume-profile and market-structure indicator designed to combine a large rolling Buyers/Sellers Volume Profile with dynamically generated support and resistance levels.
Instead of treating the volume profile and swing structure
Vol-Control Fund PositioningThe investors who sell because nothing happened
In 2017 the American stock market was so calm that a whole class of institutional portfolios held more equities than their own capital, simply because the rules they follow told them to. Reconstructed with the model behind this indicator, their estim
RedK Multi-Modal TrailingStop (RedK MMTStop)█ RedK MMTStop - Release Notes
Introduction & background
RedK MMTStop is a Multi-Modal Trailing Stop indicator - Let's quickly explore the "trailing stop" concept first as a refresher - then explain what a multi-modal trailing stop indicator does.
A "Trailing Stop" is what helps traders avoi
Trend Target Ribbon [BOSWaves]Trend Target Ribbon - ALMA Conviction Trend Detection with Integrated Structure-Based Position Planning and R-Multiple Target Tracking
Overview
Trend Target Ribbon is an ALMA-based trend identification system that combines slope-normalized momentum confirmation with standard deviation band
Wyckoff [theUltimator5]This indicator was designed to be a comprehensive, intuitive, overly engineered algorithm that plots Wyckoff accumulation and distribution patterns on the chart as they arise. It shows the current status of the regime on a side panel, while also overlaying the accumulation or distribution schematic
XeL OnlineRecursionXeL OnlineRecursion is a Pine Script library for online and streaming statistical estimation on continuous numerical and financial data.
The library is designed around recursive statistical populations whose retained state is updated observation by observation. Most recursive components use consta
Dual-Phase Reversal by DGTDual-Phase Reversal • Exhaustion, Pivots & Pressure
Dual-Phase Reversal (DPR) is a two-phase market exhaustion framework that tracks directional momentum through Momentum Exhaustion and Terminal Exhaustion . It combines sequential price conditions, Momentum Shift initiation, phase qualificatio
Zeiierman Trend Pressure (Zeiierman)█ Overview
Zeiierman Trend Pressure (Zeiierman) is a multi-layer trend pressure and exhaustion oscillator designed to visualize short-term momentum, persistent trend structure, directional pressure, and exhaustion states within a normalized 0 to -100 range.
Instead of relying on a single osci
Volume Delta Footprint Map (Zeiierman)█ Overview
Volume Delta Footprint Map (Zeiierman) is a lower-timeframe volume delta mapping indicator that visualizes where buying and selling pressure develops across both price and time.
The indicator uses lower-timeframe data to estimate the buying and selling activity occurring inside each
See all indicators and strategies
Community trends
Nvidia - Preparing the ultimate +100% breakout!🏅Nvidia ( NASDAQ:NVDA ) will double in the near future:
🔎Analysis summary:
For the entire past year, Nvidia has not been able to break the previous all time high resistance. But looking at the monthly candle of October, Nvidia is now attempting the bullish breakout. If the breakout is confirm
The AI Boom Is Running on Borrowed Money. Should Traders Worry?The AI boom has found a new investor: The bond market.
The artificial intelligence boom has produced extraordinary revenue, record-breaking stock rallies and a seemingly endless appetite for Nvidia NASDAQ:NVDA chips. Now comes the bill.
SpaceX NASDAQ:SPCX is seeking $40 billion in financing
STX Building a Triangle Squeeze, Watching for BreakoutNASDAQ:STX continues to coil inside a multi-month symmetrical triangle, with higher lows pressing against a descending resistance trendline.
Price is currently trading just below the key breakout level near 866. The longer this compression persists, the greater the potential expansion move once pr
TREO - Momentum Starts to Shift!Tactical Resources Corp. remains in a broader bearish structure, but the chart is beginning to show some interesting signs worth monitoring closely.🔍
From a technical perspective, NASDAQ:TREO has been respecting the Sine Line rhythm quite nicely. If this cycle continues to play out as it has s
T Long

Nvidia (NVDA) 2026+ Catalysts & Risks Institutional OverviewNVDA (2026+) Catalysts, Risks & Financials: Ranked Analyst Views
As of August 10, 2026. Stock ~$222–223. Consensus rating Strong Buy (58 of 61 analysts buy/strong-buy); average 12-month price target ~$302–304 (~+47% upside); range $180 (low) → $500 (high). Next earnings ~Aug 26–27, 2026 (Q2 FY2027)
BROADCOM eyes its 1W MA100 to reload the bull case.Broadcom Inc. (AVGO) has been trading within a Channel Down since its June 03 2026 High, which wasn't just an All Time High (ATH) but a Top rejection on the Higher Highs trend-line that started back on September 11 2025.
A similar Higher Highs trend-line was what made the stock test a long-term Sup
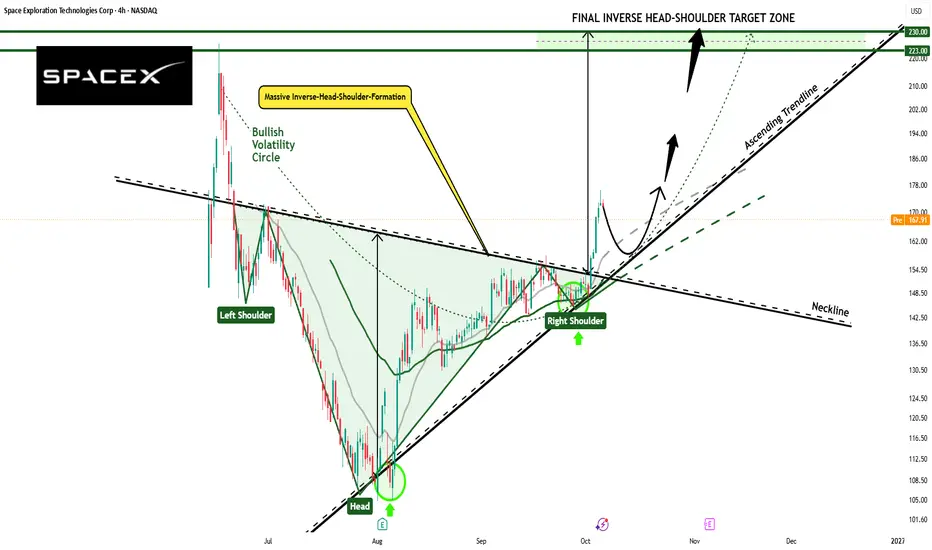
SPCX: Massive Inverse Head-Shoulder-Formation, Targets Ahead!Hello Community,
welcome to my new analysis of SPCX from a 4-hour timeframe perspective. In recent times, the price of SPCX has bounced to the upside, confirming new bullish developments. Now, I have detected an interesting formation that SPCX just completed, guiding the way towards the upper targ
NFLX | Flip Zone Reached, The Gap Sits AboveBy analyzing the #NFLX (Netflix, Inc.) chart on the Daily timeframe, we can see a market that reached a weekly Order Block, shifted structure upward from it, and has now sold back into the one zone that decides whether that shift was real.
━━━━━━━━━━━━━━━━━━━━
DAILY TIMEFRAME
━━━━━━━━━━━━━━━━━
TSLA: Targeting $1,000Tesla reaching $1,000 within a year may sound ambitious, but the weekly chart gives us a reason to consider it.
The long-term rising channel remains intact, and the shorter channel offers a possible route toward higher prices. An advance toward $1,000 would fit within that broader structure, althou
NVDA: Institutional Breakout or Liquidity Trap?📊 Macro & Technical Breakdown: NVDA
NVIDIA Corporation continues to showcase immense relative strength, functioning as the primary locomotive for the broader technology sector. As institutional order flow aggressively builds up around the current price cluster, the asset is actively transitioning
See all stocks ideas
Today
ANGOAngioDynamics, Inc.
Actual
−0.04
USD
Estimate
−0.11
USD
Today
PEPPepsiCo, Inc.
Actual
2.34
USD
Estimate
2.29
USD
Today
HELEHelen of Troy Limited
Actual
—
Estimate
0.50
USD
Today
TLRYTilray Brands, Inc.
Actual
−0.32
USD
Estimate
−0.18
USD
Today
BYRNByrna Technologies, Inc.
Actual
−0.13
USD
Estimate
−0.16
USD
Today
PGRProgressive Corporation (The)
Actual
—
Estimate
4.30
USD
Today
CMTLComtech Telecommunications Corp.
Actual
—
Estimate
−0.51
USD
Today
CHRNChronoScale Holdings Corporation
Actual
—
Estimate
−0.09
USD
See more events
Community trends
BTCUSD — Market Structure, Liquidity & Order Block AnalysisThis analysis focuses on the current price structure of BTCUSD using market structure, liquidity,
order blocks, BOS/CHoCH, and key support/resistance areas.
Price has previously established a strong bullish expansion from the 80,000–80,500 order block and reversal area, followed by a significant mo
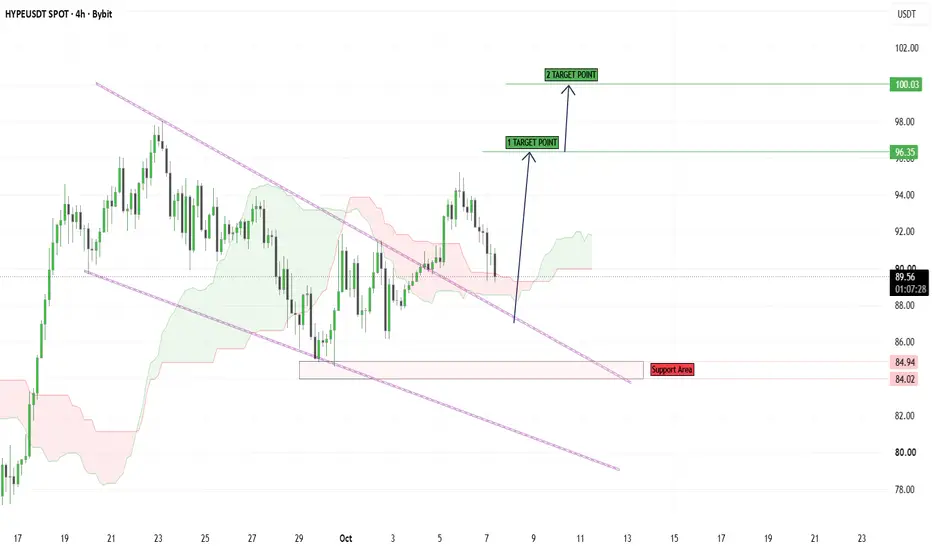
HYPEUSDT – Bullish Breakout & Upside Expansion Setup📊 HYPEUSDT – Bullish Breakout & Upside Expansion Setup
🔍 Market Overview
HYPEUSDT is showing signs of a bullish continuation structure on the 4H chart. Price has recovered from the lower support region and is holding above the descending trendline area, while the Ichimoku Cloud is beginning to p
BTCUSD Bullish Reversal — Support Bounce Toward Resistance
BTCUSD is showing a potential **bullish reversal from the 82,700–82,900 support zone** after a sharp decline. Price is attempting to recover from support, while the previous breakdown area around **84,500** acts as the first upside target.
If BTC reclaims and holds above 84,500, the next major tar
BTCUSDT | BUY SETUP...
🟠 BTCUSDT | BUY SETUP
📍 Buy Zone: 83,600–83,800
🎯 Target 1: 84,800
🎯 Target 2: 85,600
🎯 Target 3: 86,800
🛡️ Invalidation: 82,400
Technical Analysis:
Price ne 86,000–86,800 resistance se sharp rejection liya hai, lekin current decline rising trendline ke lower area aur major 82,400–82,700 suppor
BTC Bullish Harmonic Pattern: Upside Targets In FocusBTC Bullish Harmonic Pattern: Upside Targets In Focus
Bitcoin completed a bullish harmonic pattern near the 83600 level. At the D completion point, the price made a quick reaction indicating that we have buyers around that area.
I think that the bullish move should unfold from this momentas show
BTCUSD (Bitcoin) : Bearish Retest Setup Target $80,000 SupportExecutive Summary
Bitcoin (BTCUSD) has broken down below its ascending trendline support and local consolidated structure on the 4-hour time frame. Price action projects a corrective pullback toward the Fib retracement confluence zone before extending downward toward the major daily support level n
BTCUSDT Strengthens After the Range Bounce — 88,000 AwaitsHello traders! Here’s my technical outlook based on the current BTCUSDT (3H) chart structure. BTCUSDT previously traded inside a descending structure before breaking higher and shifting bullish. Price then formed a range near the Buyer Zone, tested higher levels, and bounced from support. Currently,
ETH/USD 2H: Support Zone Bounce — Targets $2,648 & $2,732Ethereum (ETH/USD) is testing a major **support zone around $2,553–$2,571** after a sharp sell-off. The chart shows a potential bullish rebound from this area.
* **Support Zone:** $2,553–$2,571
* **TP1:** $2,648 — minor resistance/support level
* **TP2:** $2,732 — major resistance zone
* **Resistan
BITCOIN - The liquidity hunt phase ahead of the rally BINANCE:BTCUSDT.P continues to consolidate within the current bullish cycle. A liquidity-hunting phase is forming ahead of a possible continuation of the rally.
Bitcoin maintains a bullish market structure, with consolidation forming above the key resistance at 82,500. Within the current bulli
BITCOIN How to prepare for a 1D MA50 test.Bitcoin (BTCUSD) is on a 3-day bearish streak and is approaching its 1D MA50 (blue trend-line), which has been intact since the August 17 bullish break-out. That would be the most critical short-term test for the market but it doesn't stop here. At the same time it is about to hit Pivot 1, which was
See all crypto ideas
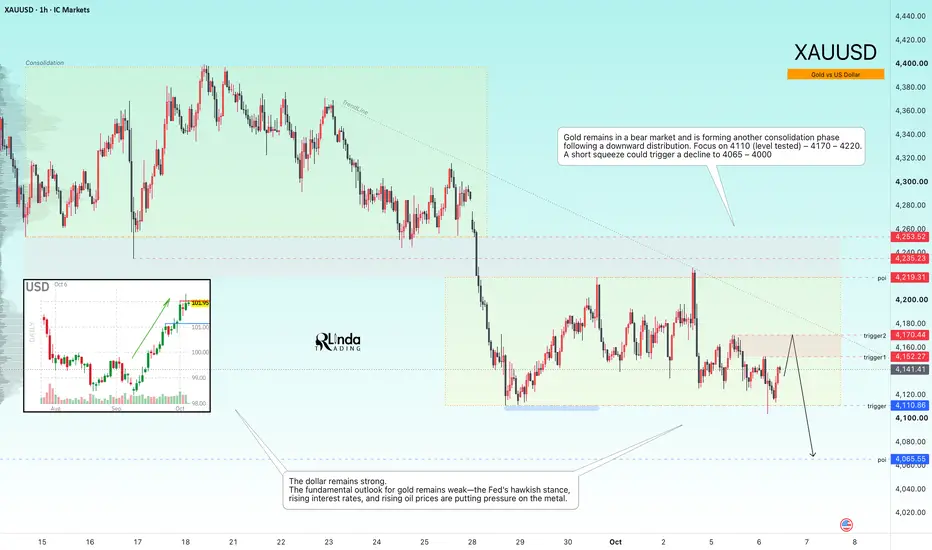
GOLD - Consolidation near 4,100. Bearish trend ICMARKETS:XAUUSD remains under pressure from the bearish trend and a strong dollar, confirming its bearish market structure. A retest of the 4,110 support is forming, along with a pre-breakout base...
Gold has resumed its decline and is threatening the $4,100 level after pulling back from $4,2
X Short

XAUUSD 4H | Institutional Liquidity Mapping & Price Action StudyXAUUSD 4H | Educational Fundamental & Technical Analysis
Oil is under strong selling pressure, which can reduce inflation pressure and support expectations for softer rates.
This environment can support Gold buying, while geopolitical tensions involving the U.S., Iran, Russia–Ukraine and the Midd
GOLD Bearish Confirmed , Best Place For Sell Spotted , 500 Pips Here Is My 30 Mins GOLD Chart And This Is My Opinion , Finally We Have A Clear breakout below our support and this breakout end the sideway movement that we stay on it for more than 2 weeks , and now we have a very clear area we can sell it around 4110.00 to 4120.00 will be my best best place for se
XAUUSD — Liquidity Sweep + CHoCH + Trendline Break + Order Block
This analysis presents a complete SMC liquidity-based reversal model using liquidity sweep, market structure, trendline behavior, support/resistance, and Order Block confirmation.
The market initially remains under a descending trendline, showing that sellers are controlling the broader move. As p
GOLD Price Update – Clean & Clear ExplanationGold is showing a strong rejection from the 4,179–4,198 resistance/supply zone, with price failing to hold above the previous structure and turning lower from the retest area.
The fundamental picture is also keeping pressure on Gold. A firm U.S. Dollar and elevated Treasury yields have recently wei
X Short

XAG/USD - H1 Wedge Breakout (07.10.2026)XAGUSD H1 has confirmed a bullish wedge breakout after breaking the descending trendline and reclaiming 61.00. Price is holding above the broken trendline, showing bullish momentum is building after repeated rejection from the 59.50–60.00 support zone. The move clears the path to 63.00 first resista
XAU/USD | 4000 or 4200? Either way, FOMC dictates!By examining the 4H Chart of Gold we can see that Gold has been in a consolidation phase for a while now, and is moving between the two 4H FVGs as pinpointed on the chart, currently being traded at around 4133 level, above the 4H FVG High.
My main bias for Gold remains Bearish, but at the moment it
Gold 30Min Engaged ( Bearish Reversal Detected )HANZO MARKET LIQUIDITY REPORT
Gold
Timeframe: 30min (Volume Basis)
Scale: Higher Timeframe Context / Deep Volume analysis
━━━━━━━━━━━━━━━━━━━━━━
Market Observation
This analysis is focusing on structural behavior, liquidity zones, Volume analysis
and key areas of interest within the current range.
THE KOG REPORT - UpdateEnd of day update from us here at KOG:
Another ranging but choppy day on gold which has given good opportunities for both bulls and bears for scalping, but holding, its not happening!
Yesterday we said although the path is working, there was a level below at 4106 which if tapped into can give us a
Gold Has Two Liquidity Targets. One Side Is About to LoseGold is trading around 4,142, but the current price is not where I see the real opportunity.
The more important story is happening on both sides of it.
Below price, sell-side liquidity is sitting around 4,112, with the previous low near 4,105 still exposed.
Above price, Gold has unfinished busine
See all futures ideas
USD/JPY - Triangle Breakdown (08.10.2026)USDJPY ascending triangle breakdown has confirmed on the 1H timeframe following a sharp rejection from the 158.50 resistance zone. The market faced strong rejection from the 158.50 structural barrier, and sellers have regain control with strong candle confirmation. The ascending trendline support i
GBPUSD 2H: Bullish Breakout Retest & Continuation PotentialGBPUSD 2H: Bullish Breakout Retest & Continuation Potential
GBPUSD (FX_IDC:GBPUSD) has broken above its primary descending trendline channel on the 2H timeframe and is currently holding inside the key support area (1.3200 - 1.3250). Price is consolidating above this demand base following the breakou
EUR/GBP Triangle FormationEURGBP shows a well-defined triangle formation on the 30-minute chart, with price compressing beneath the 0.8493 resistance key zone and the falling trendline, creating a clear breakout and retest setup. The 0.8490 psychological level sits near the resistance area, and bullish momentum is fading as
USDCAD Bearish Rejection | Support Levels in Focus (2H)
USDCAD has been rejected from the 1.4250–1.4280 resistance area after trading within an ascending structure. Price has pulled back sharply, making the marked support levels important for the next move.
🟥 Resistance Zone: 1.4250–1.4280
🔻 1st Support Objective: 1.4170
🔻 2nd Support Objective: 1.4090
GBPUSD Preparing for a Rally? Harmonic Pattern Signals HigherGBPUSD Preparing for a Rally? Harmonic Pattern Signals Higher
This large Bullish Harmonic Pattern held up well against the FOMC rate decision. It held up well against the US inflation data and the very high US Treasury yields.
So after all the turmoil we had these days, GBPUSD is holding strong.
GBPUSD Bullish Rebound Setup GBPUSD is showing a potential bullish rebound from the lower support zone around **1.3180–1.3200**. Price is attempting to recover after the recent decline, with the marked levels acting as upside targets. A sustained move above **1.3245** could open the way toward the higher target near **1.3280–1
GBPUSD Bearish Trendline Rejection | Downside Pressure Builds🔹 GBPUSD remains within a broader bearish market structure, with price respecting a descending trendline and forming lower highs across the chart. The recent recovery toward the upper boundary of the structure faced rejection near the 1.328–1.335 resistance area, where sellers stepped back in. Price
GBPUSD is Nearing a Strong Resistance Area!Hey Traders, in today's trading session we are monitoring GBPUSD for a selling opportunity around 1.32700 zone, GBPUSD is trading in a downtrend and currently is in a correction phase in which it is approaching the trend at 1.32700 support and resistance area.
Trade safe, Joe.
EURUSD: A False Break at 1.1200 Could Trigger a RecoveryHello everyone, here is my breakdown of the current EURUSD setup.
Market Analysis
EURUSD previously formed a Rounding Top and traded inside a wedge structure before breaking lower. Price then tested the Support Zone with a fake breakout and rebounded, showing signs of buyers stepping in.
Current
USDJPY 30Min Engaged ( Bearish Reversal Detected )HANZO MARKET LIQUIDITY REPORT
USDJPY
Timeframe: 30min (Volume Basis)
Scale: Higher Timeframe Context / Deep Volume analysis
━━━━━━━━━━━━━━━━━━━━━━
Market Observation
This analysis is focusing on structural behavior, liquidity zones, Volume analysis
and key areas of interest within the current range
See all forex ideas
Trade directly on Supercharts through our supported, fully-verified, and user-reviewed brokers.