Today, we’re adding 17 new functions and variables to our Pine scripting language, including the Money Flow Index, Price-Volume Trend, and more. If you haven’t yet had a chance to explore Pine, you can start here. We hope those of you already familiar with Pine will enjoy these new additions.
New Variables:
iii (The Intraday Intensity Index) is a volume-based technical indicator that integrates volume with a symbol’s price. It can be used to follow how intraday highs and lows are moving with volume in comparison to the previous day’s closing price.
wvad (The Williams Variable Accumulation/Distribution) indicator is a running total of volume that shows the momentum for a symbol within a period.
wad (Williams Accumulation/Distribution) measures positive and negative market pressure. It is based solely on price data and here, accumulation/distribution represents the sum of positive (accumulation) and negative (distribution) price movements.
obv (On-balance volume, OBV) is a technical trading momentum indicator that uses volume flow to predict changes in price.
pvt (The Price-Volume Trend) is an indicator that helps determine price direction and the strength of price change.
nvi (The Negative Volume Index) is a technical indication line that integrates volume and price to graphically show how price movements are affected from down volume days.
pvi (The Positive Volume Index) is an indicator used in technical analysis that provides signals for price changes based on positive increases in trading volume.
New Functions:
cmo (The Chande Momentum Oscillator) calculates the difference between the sum of recent gains and the sum of recent losses. It then divides the result by the sum of all price movements over the same period.
mfi (Money Flow Index) is a technical oscillator that uses price and volume for identifying overbought or oversold conditions in an asset. It can also be used to spot divergences, which can warn of a trend change in price.
bb (Bollinger Bands) are a technical analysis tool defined by a set of lines plotted two standard deviations (positively and negatively) away from a simple moving average (SMA) of price. However, it can be adjusted to user preferences.
bbw (Bollinger Bands Width) is a technical analysis indicator derived from the standard Bollinger Bands indicator. Bollinger Bands Width serves as a way to quantitatively measure the width between Upper and Lower Bands. It can also be used to identify trading signals in some instances.
kc (Keltner Channels) are a volatility based technical indicator composed of three separate lines. The middle line is an exponential moving average (EMA) of the price. Additional lines are placed above and below the EMA. The upper band is typically set at twice the Average True Range (ATR) above the EMA, and the lower band is typically set the same distance below the EMA. The bands expand and contract as volatility (measured by ATR) expands and contracts.
kcw (Keltner Channels Width) calculates the difference between the upper and lower Keltner Channels lines.
dmi (DMI/ADX) consists of three indicators that measure a trend’s strength and direction. The Direction Movement Index (DMI) is composed of three lines: the ADX (black line), DI+ (green line) and DI- (red line). The Average Directional Index (ADX) line shows the strength of the trend. The higher the ADX value, the stronger the trend. The Plus Direction Indicator (DI+) and Minus Direction Indicator (DI-) show the current price direction. When the DI+ is above DI-, current price momentum is up. When the DI- is above DI+, current price momentum is down.
wpr (Williams % R) is a type of momentum indicator that moves between 0 and -100. It measures overbought and oversold levels. The Williams % R may be used to find entry and exit points in the market.
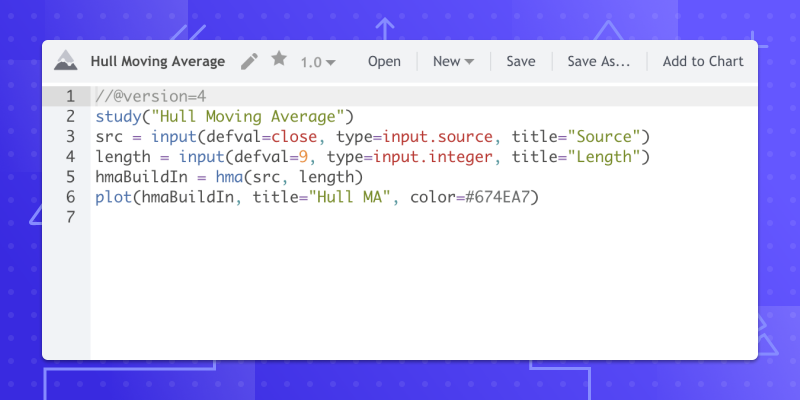
hma (The Hull Moving Average) emphasizes recent prices over older ones, resulting in a fast-acting, yet smooth moving average that can be used to identify the prevailing market trend. It can also be used for entry and exit signals. The indicator is mostly used by swing and long term traders in combination with other signals and analysis techniques.
supertrend (SuperTrend) is a trend following indicator. If the SuperTrend is above the price, then it’s a downtrend, if it is below the price, then it’s an uptrend. It does not predict the direction, rather once the direction is stabilized, it will guide you to initiate a position and suggests you stay in the position until the trend ends.