Not all Pine updates warrant a separate blog post, but you never know when a new feature might come in handy for coding your scripts. This post showcases the recent improvements that might have slipped under your radar.
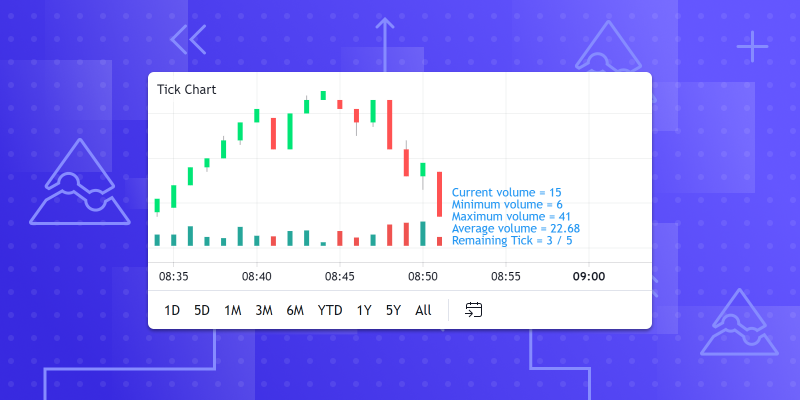
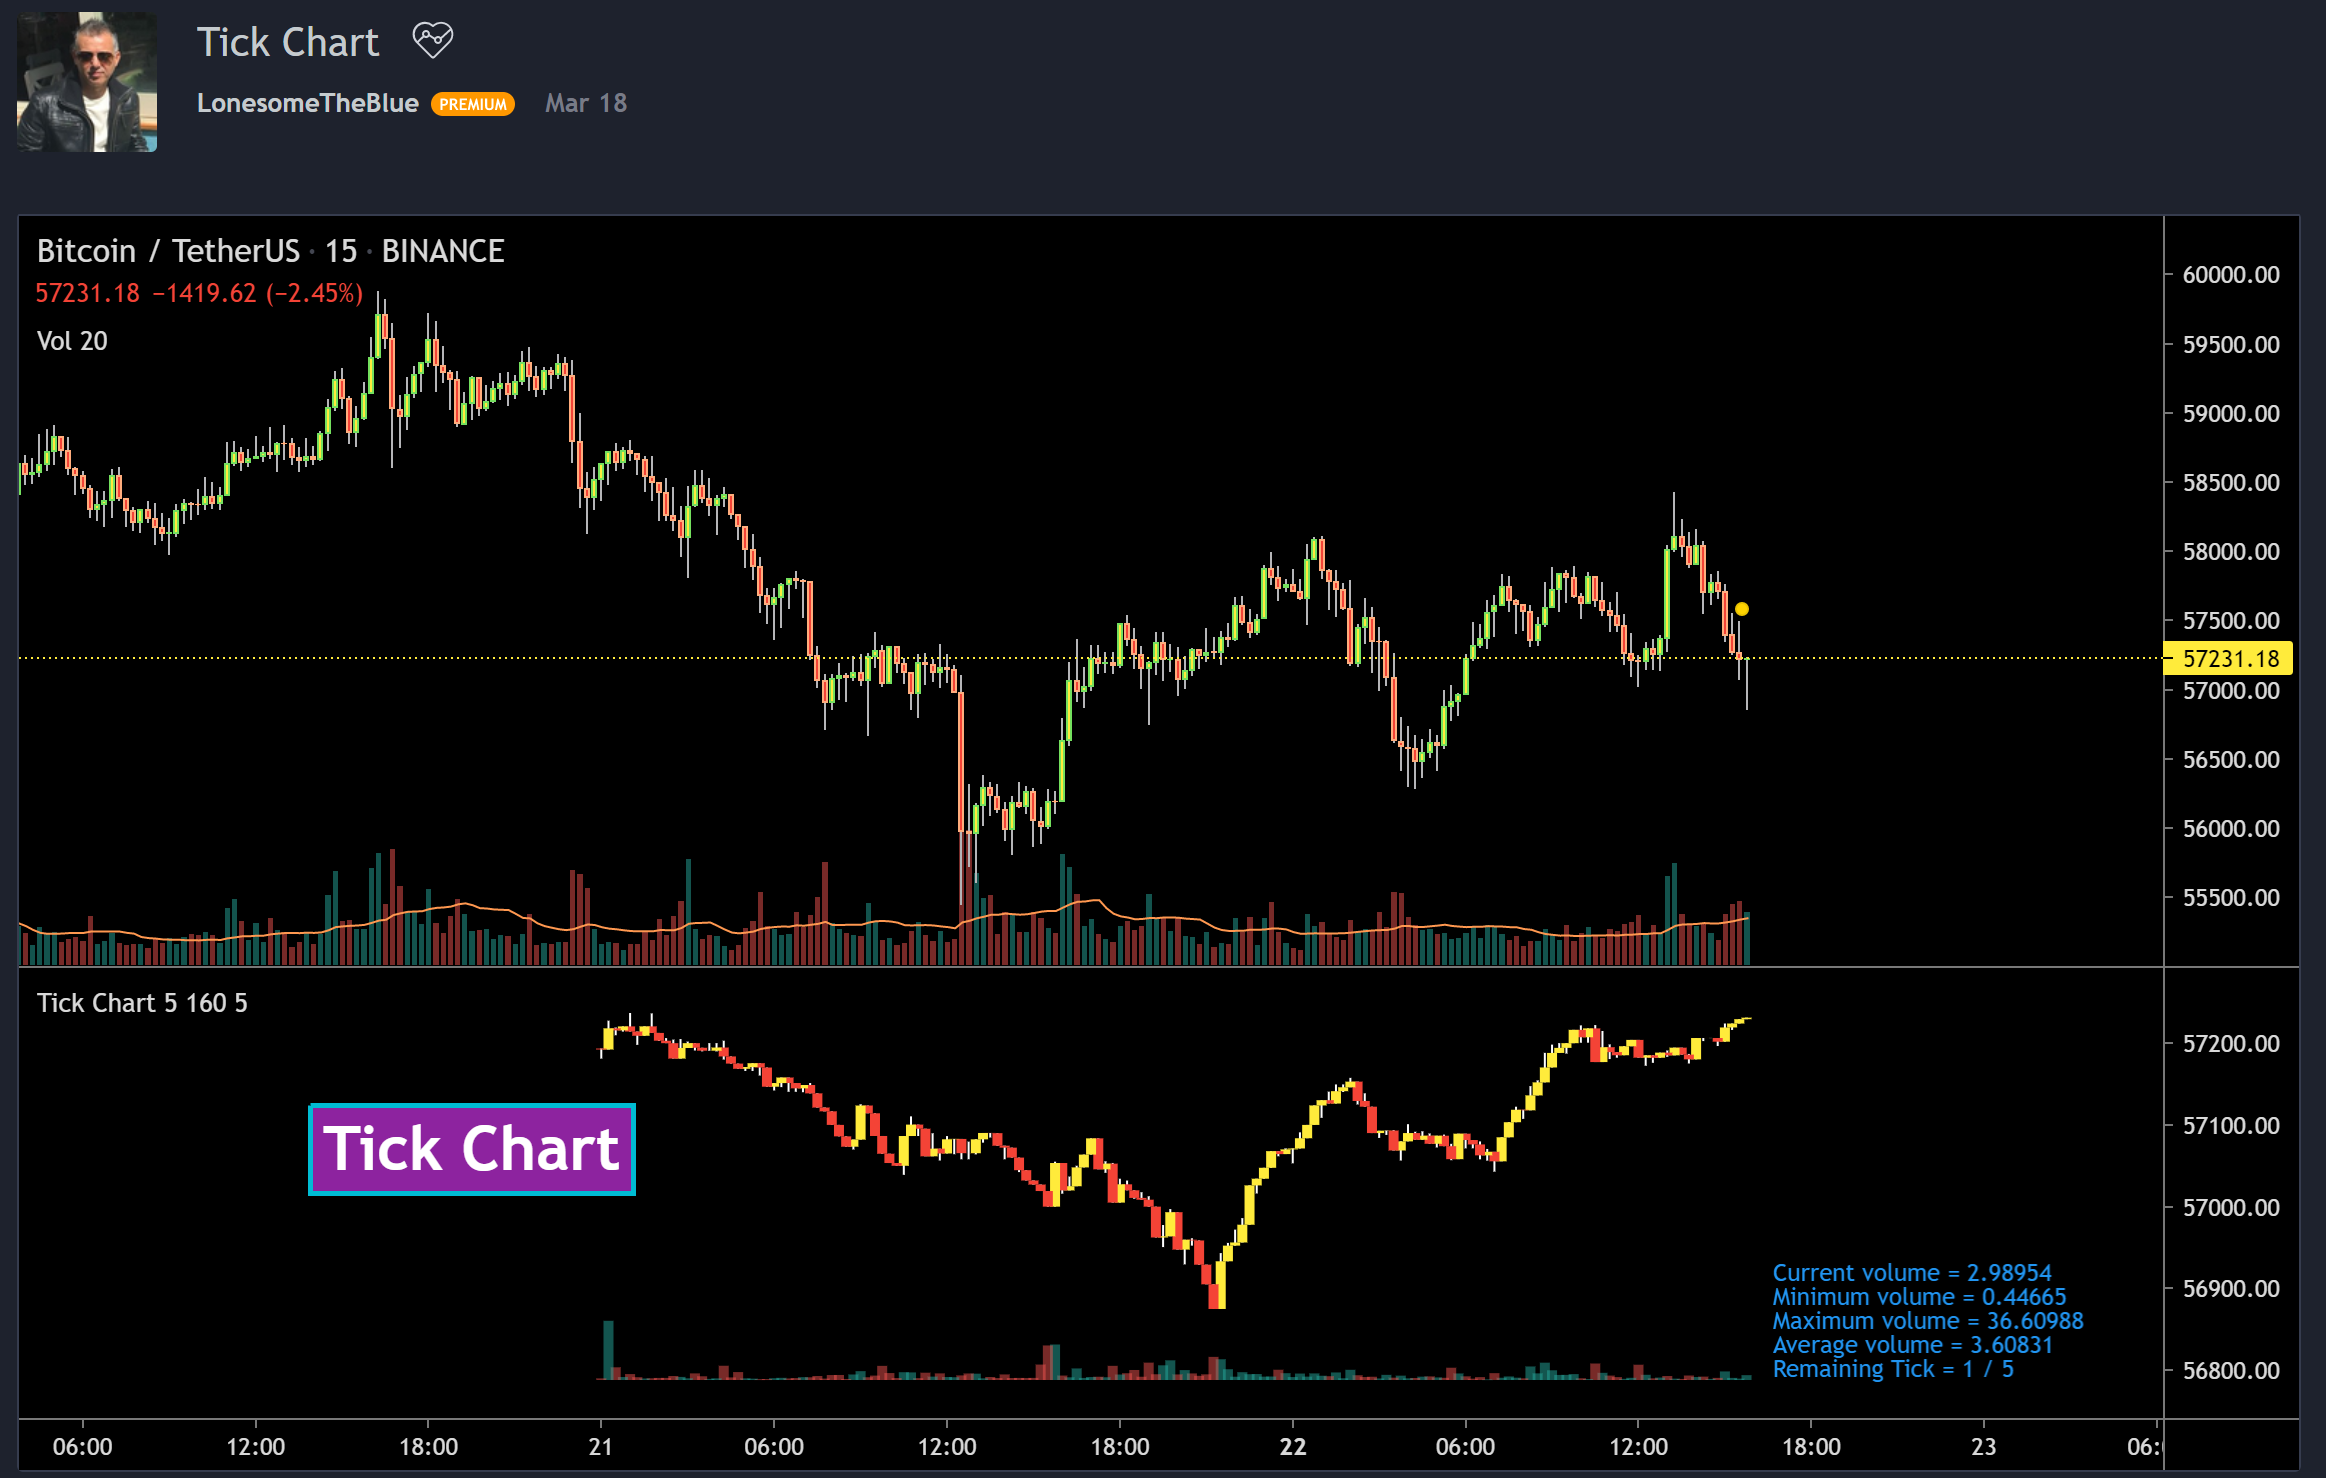
The varip keyword is useful for when you want to keep track of some data and how it changes inside the realtime bar. All regular Pine variables are subject to what is known as a rollback, where on each new data tick, the state of the variable is reset back to its value on the previous bar before evaluating the new data. The varip keyword escapes this and enables you to compare the current value of a variable with its value on the previous tick (as opposed to the previous bar), which opens up a whole new world of possibilities. Take a look at a tick chart created by one of our Pine Wizards LonesomeTheBlue:
https://www.tradingview.com/script/ygNO2G1V-Tick-Chart/
To learn more, read the in-depth tutorial on varip by PineCoders:
https://www.tradingview.com/script/ppQxBISk-Using-varip-variables-PineCoders/
For those of you who wanted more math in Pine, we now have a whole set of new math-related functions and constants:
- New constants math.pi, math.phi, math.rphi and math.e
- New round() functionality — the function now allows you to specify the precision of the rounding, instead of always rounding to the nearest integer
- median()
- mode()
- range()
- todegrees()
- toradians()
- random()
Here’s a strategy for those of you who also like to live dangerously: all entries and exits are randomized based on the percentages that are specified in the Inputs section, all thanks to the random() function:
//@version=4
strategy("I’m feeling lucky", overlay=true)
seed = input(1, "Seed, increase to recalculate the strategy", minval=1)
entryPerc = input(20.0, "Entry chance, %", minval=0.0, maxval=100.0)
exitPerc = input(10.0, "Exit chance, %", minval=0.0, maxval=100.0)
roll = random(0, 100, seed)
positionSize = floor(random(1, (strategy.equity / close), seed))
if roll < entryPerc
    strategy.entry("My Long Entry Id", strategy.long, qty=positionSize)
if roll < exitPerc
    strategy.close_all()
In another development, the := assignment operator has been merged with the arithmetic operators to create new assignment operators +=, -=, *=, /= and, %=. These allow you to tidy up and shorten your scripts: instead of using a := a + 1 you can simply write a += 1. A small, but quite convenient, improvement.
If you’ve ever found yourself needing to convert a string into a number, the new tonumber() function enables you to do just that. For example, in the script below, tonumber(), in conjunction with other string-related functions like str.split() and str.replace_all(), allows a single string input field to return several integer values that are then used as lengths for the SMA calculations. There is no compelling reason to do it this way instead of the correct and convenient “a separate input for each of the SMAs” way… But if you need it, it’s here:
//@version=4
study("My SMAs", overlay=true)
sma_lengths = input("5, 10, 20, 30, 50", title = "SMA Lengths (separated by comma)")
sma_lengths_array = str.split(str.replace_all(sma_lengths, " ", ""), ",")
sma_len(index) =>
    index > array.size(sma_lengths_array) - 1 ? 10 :
     int(tonumber(array.get(sma_lengths_array, index)))
sma0 = sma(close, sma_len(0))
sma1 = sma(close, sma_len(1))
sma2 = sma(close, sma_len(2))
sma3 = sma(close, sma_len(3))
sma4 = sma(close, sma_len(4))
plot(sma0, color=color.blue)
plot(sma1, color=color.red)
plot(sma2, color=color.green)
plot(sma3, color=color.orange)
plot(sma4, color=color.purple)
We’ve added a time_tradingday variable, which returns the UNIX timestamp of the beginning of the trading day. This will come in handy when analyzing symbols that are traded overnight, like EURUSD, where trading starts on Sunday while technically, the trading day is actually Monday.
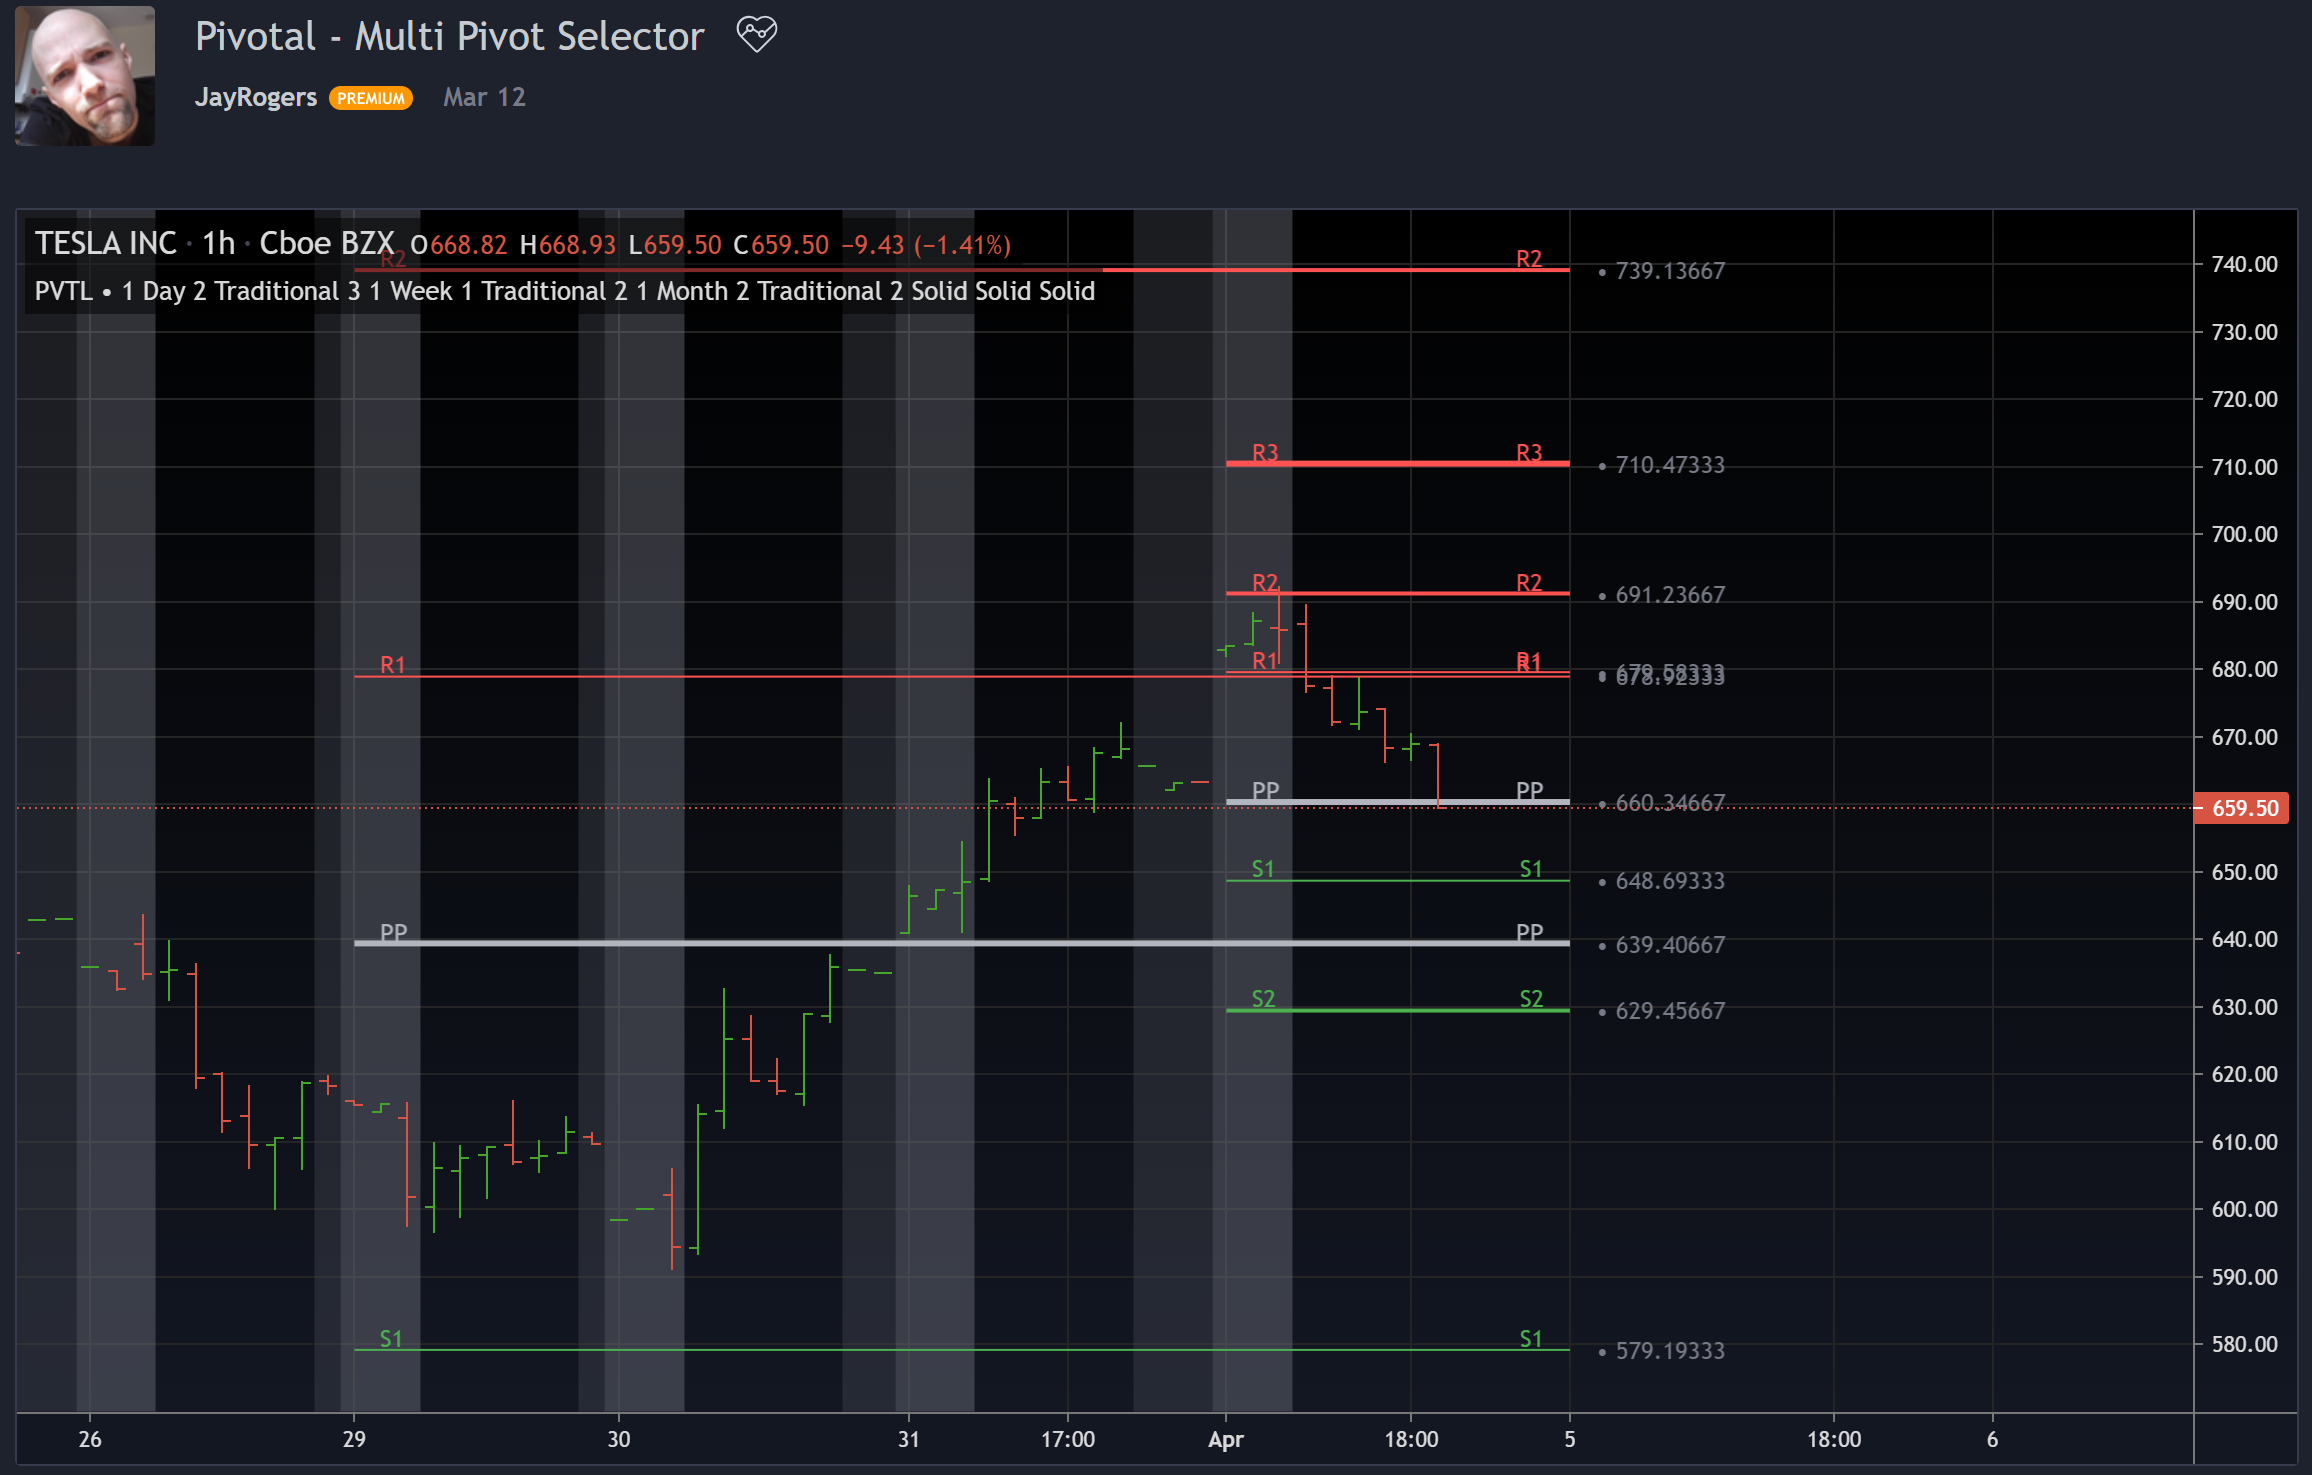
The new time_close() function allows you to get the closing time of a bar from a specified timeframe and session (in contrast to the previously existing time_close variable, which only works with the chart’s timeframe/session). This is especially useful for drawings, enabling you to draw lines and labels into the future more precisely. To see it in action, check JayRogers’s take on the Pivot Points indicator:
https://www.tradingview.com/script/7EwXUkBE-Pivotal-Multi-Pivot-Selector/
With the new format.percent parameter to study(), the output of your script can now be automatically formatted as a percentage. See it in action with our built-in Aroon indicator:
//@version=4
study(title="Aroon", shorttitle="Aroon", overlay=false, format=format.percent, precision=2, resolution="")
length = input(14, minval=1)
upper = 100 * (highestbars(high, length+1) + length)/length
lower = 100 * (lowestbars(low, length+1) + length)/length
plot(upper, "Aroon Up", color=#FF6A00)
plot(lower, "Aroon Down", color=#0094FF)
Three new variables, session.ismarket, session.ispremarket, and session.ispostmarket, allow you to check the part of the intraday session to which the current bar is related. Note that extended hours only show up on intraday charts, and only when the option is explicitly enabled through the settings.
If you want to learn about Pine updates as soon as they happen, monitor the Release Notes in our User Manual. PineCoders also broadcast news on updates in their Squawk Box Telegram channel, on Twitter and in the Pine Script public chat on TradingView.
We hope you find these improvements useful. Please continue sending us your feedback. We build TradingView for our users and we love hearing from you.