오늘부터 트레이딩뷰에서 인베스터는 자신이 관심갖는 스탁의 파이낸셜 데이터로 차트를 볼 수 있습니다. 레비뉴 트렌드 분석, 회사 실적에 대단 숨겨진 내용 파악 등을 해 보십시오. 이번 새 릴리즈는 회사의 파이낸셜 상황 평가에 필요한 파이낸셜 데이터를 모든이에게 제공하여 그 회삭 고평가 또는 저평가 되어 잇는 지를 결정하게 해 줍니다.
시작하려면 트뷰 차트 맨 꼭대기에 있는 파이낸셜 버튼을 찾아 누르도록 하십시오:

트레이딩뷰 파이낸셜 데이터는 4가지 주요 카테고리로 나뉩니다: 인컴 스테이트먼트, 밸런스 시트, 캐쉬 플로우, 및 레이쇼. 차트 맨 위 파이낸셜 버튼을 누르면 이 4가지 카테고리를 보여주는 윈두오가 나오는데 각 그룹별로 서로 다른 인디케이터를 보여줍니다. 이곳 에서 EPS 및 EBITDA () 또는 프라이스-투-어닝 및 프라이스-투-세일즈 레이쇼 (이 내용은 레이쇼 섹션에 나옴) 를 골라 차트로 그릴 수 있는 곳입니다.
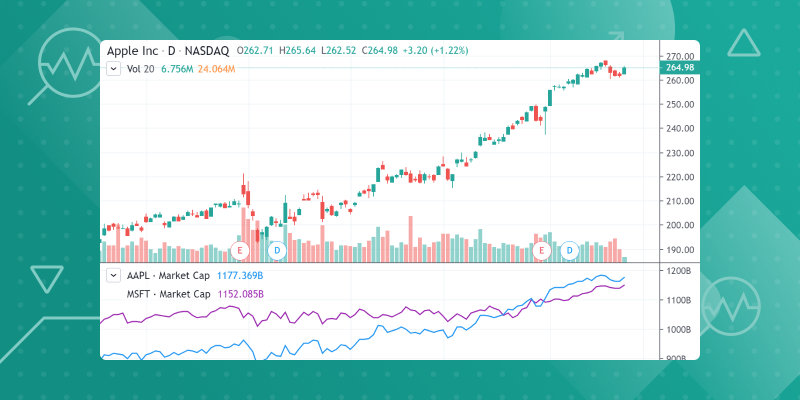
또한 같은 차트에서 서로 다른 컴패니에 대한 파이낸셜 인디케이터를 비교 및 대비해 볼 수 있습니다. 그러려면 차트위 세팅버튼을 누르고 인풋으로 가서 다른 심볼 넣기 버튼을 누르면 됩니다:

트레이딩뷰에 다음 파이낸셜 인디케이터를 더하게 되었스며 인베스터들이 그러한 파이낸셜 인디케이터를 얼마나 잘 쓰는 지 알 수 있게 되었습니다. 몇달 안으로 더 많은 인디케이터를 넣고 컴패니를 평가하는 유니크한 방법이 됩니다. 다음에 각 펀더멘털 인디케이터에 대한 자세한 가이드가 나옵니디:
인컴 스테이트먼트
| 토탈 레비뉴 | 이 필드는 총매출 및 기타 영업수이에서 디스카운트를 밴 것, 리턴 및 얼라우언스. |
| 코스트 오브 레비뉴, 토탈 | 이 필드는 판매된 상품 코스트 합계를 리턴합니다 – Excluding Depreciation & Amortization and Depreciation, Depletion & Amortization. |
| Total Operating Expenses | Represents the sum of all expenses related to operations. |
| Gross Profit | The field represents the difference between sales or revenues and cost of goods sold and depreciation. Gross profit = Revenue − Cost of goods sold incl D&A. |
| Research & Development | The field represents all direct and indirect costs related to the creation and development of new processes, techniques, applications and products with commercial possibilities. |
| Selling/General/Admin Expenses, Total | The field returns Total Operating Expenses: Research Development plus Selling General and Administrative. |
| Operating Income | The field represents the difference between sales and total operating expenses. |
| Net Income | The field returns net income available to common fully diluted EPS for the period and date(s) requested in local currency by default. |
| Diluted EPS | The field returns fully-diluted Earnings Per Share as reported on a company’s filing. |
| EBITDA | The field returns EBITDA (Operating Income Plus Depreciation & Amortization). This is calculated as the sum of EBIT (Operating Income) and Depreciation, Depletion and Amortization.
If Depreciation, Depletion, and Amortization is not available, then Depreciation, Depletion and Amortization (Cash Flow) will be substituted. Note, given the nature of the data items included in this calculation, this formula will only return data for industrial companies. |
Balance Sheet
| Total Assets | The field represents the sum of total current assets, long-term receivables, investment in unconsolidated subsidiaries, other investments, net property plant and equipment, deferred tax assets, and other assets. |
| Long Term Debt | Non-Current Portion of Long Term Debt. The field represents all interest-bearing financial obligations, excluding current portion of long-term debt, pensions, deferred taxes and minority interest. |
| Total Debt | Total Long Term Debt. The field represents all interest bearing and capitalized lease obligations. It is the sum of long and short-term debt. |
| Total Liabilities | The field represents all short- and long-term obligations expected to be satisfied by the company. |
| Total Equity | The field represents total equity for the period and date(s) requested. |
| Total Liabilities & Shareholders’ equities | The field represents the sum of total liabilities, minority interest, non-equity reserves, preferred stock and common equity. |
Cash Flow
| Cash from Operating Activities | The field represents net cash from operating activities. |
| Cash From Investing Activities | The field represents net cash from investing activities. |
| Cash From Financing Activities | The field represents net cash from financing activities. |
| Free Cash Flow | The field represents free cash flow for the entire firm. |
Ratios
| Return on Equity | This is calculated as Net Income TTM divided by the two fiscal period average of Total Shareholders’ Equity. |
| Price Book Ratio | This is calculated as Price per share divided by Book Value per Share. |
| Price Cash Flow Ratio | This is calculated as Price per share divided by Operating Cash Flow per Share. |
| Price Sales Ratio | This is calculated as Price per share divided by Sales Per Share. |
| Price Earnings Ratio | This is calculated as Price per share divided by Diluted Earnings per Share TTM. |
| Market Capitalization | This is calculated as Price per share multiplied by the Number of Shares outstanding. |
| Earnings Yield | This is calculated as Diluted Earnings per Share TTM divided by Price per share. |
While using financial data, it’s important to remember that financial data is derived from the published financial statements of companies, for example SEC filings. Sometimes a company will be missing certain data points over specific time periods and it’s often because of a change in data from the main source. This can impact the availability of that data.
It is worth noting that our data provider, Factset, uses its own methodology for collecting and processing data, which is why financial indicators on TradingView may differ from similar indicators provided by other sources. You can find more info here.
Thanks for being a TradingView member and please let us know if you enjoy this release!