Pine腳本現在可以使用強大的新陣列功能來建構自訂數據集。陣列允許程式人員在包含以下類型之一的元件的一維資料結構中進行填充、管理、和計算,從而顯著擴展了Pine的建模功能:float, int, bool, or color。
這行程式碼建立了一個稱為 level 的陣列,其中包含三個以值 na 初始化的float元件:
levels = array.new_float(size = 3, initial_value = na)
陣列支援動態調整大小。特殊函數允許對陣列進行各種轉換,包括複製、排序、和切片。特殊用途的數學函數也可以在其上進行操作:array.min(), array.max(), array.stdev(), array.avg(), array.median() 等等。
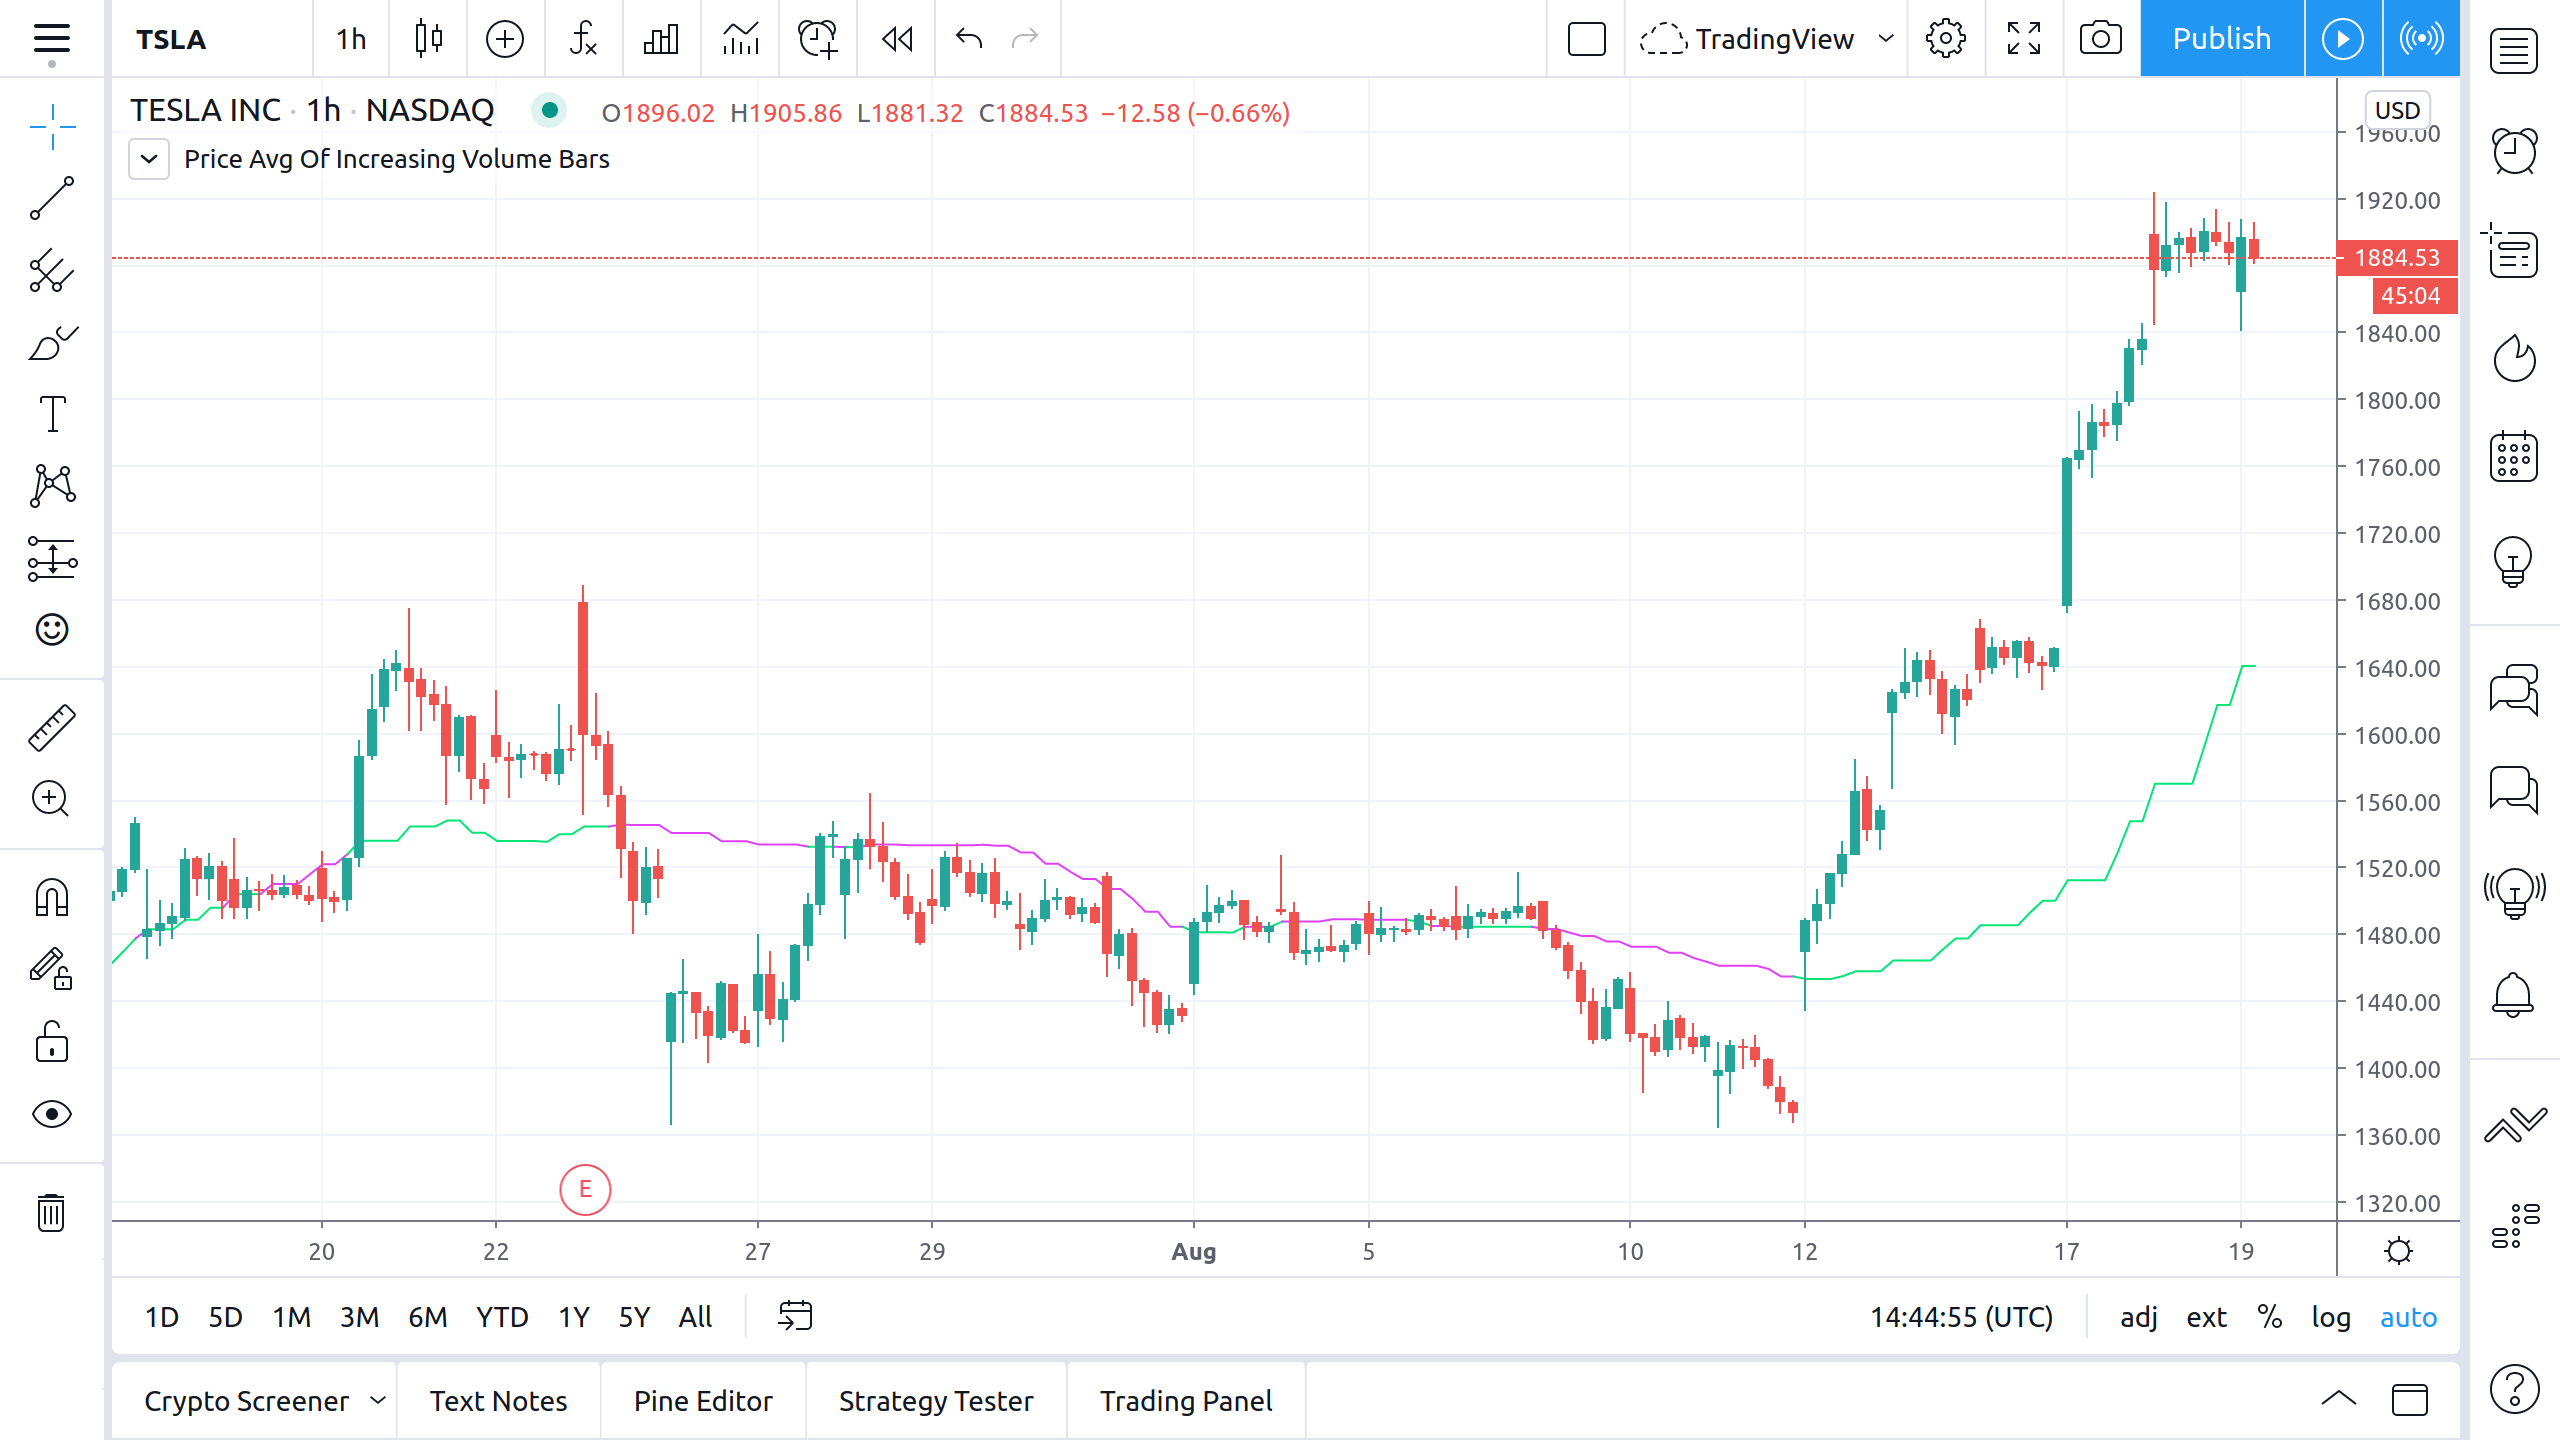
本範例使用陣列來建構僅包含數量增加的K線價格水平的數據集。然後繪製這些值的平均值。該陣列在此處用於實現FIFO(先進先出)結構:
//@version=4
study("Price Avg Of Increasing Volume Bars", "", true)
i_levels = input(20,   "Levels")
i_src    = input(hlc3, "Source")

// Initialize array of user-selected size with `na` values.
var levels = array.new_float(i_levels)

if rising(volume, 1)
    // Remove the oldest level from the beginning of the array.
    array.shift(levels)

    // Add the new level to the end of the array.
    array.push(levels, i_src)

// Calculate the avg of levels in the array, excluding any `na` values.
level = array.avg(levels)
plot(level, "Level", close > level ? color.lime : color.fuchsia)
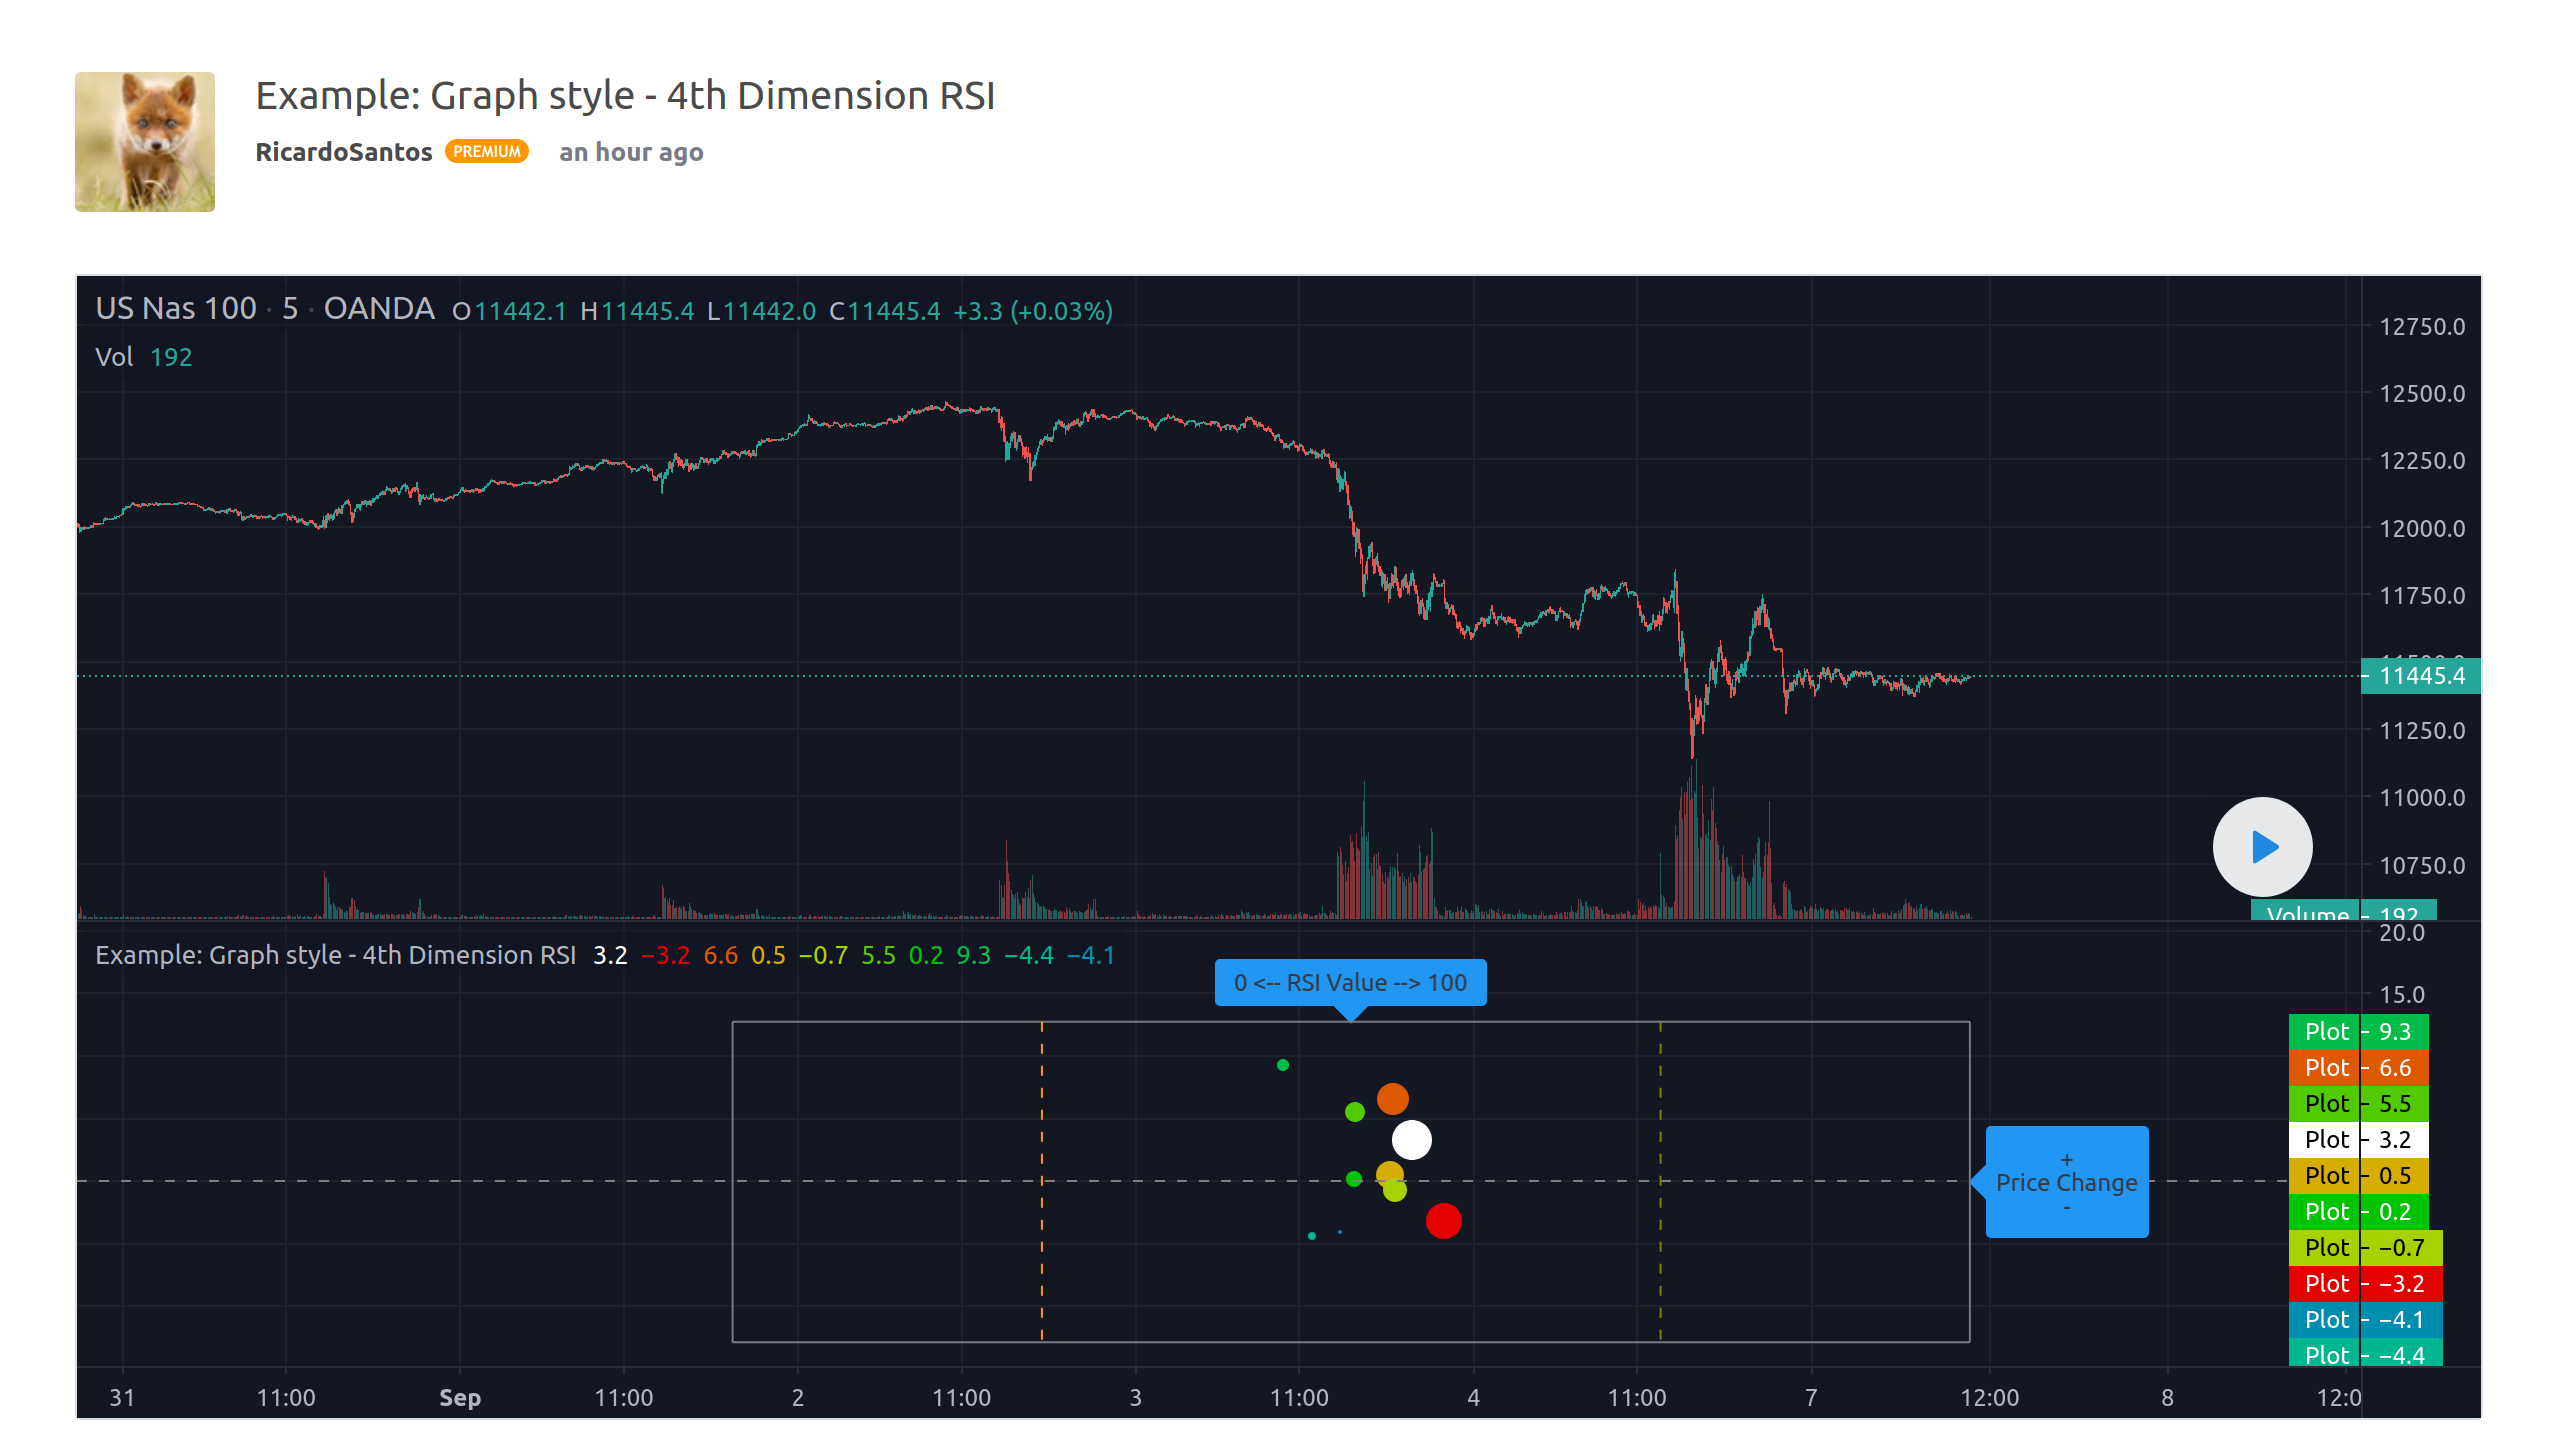
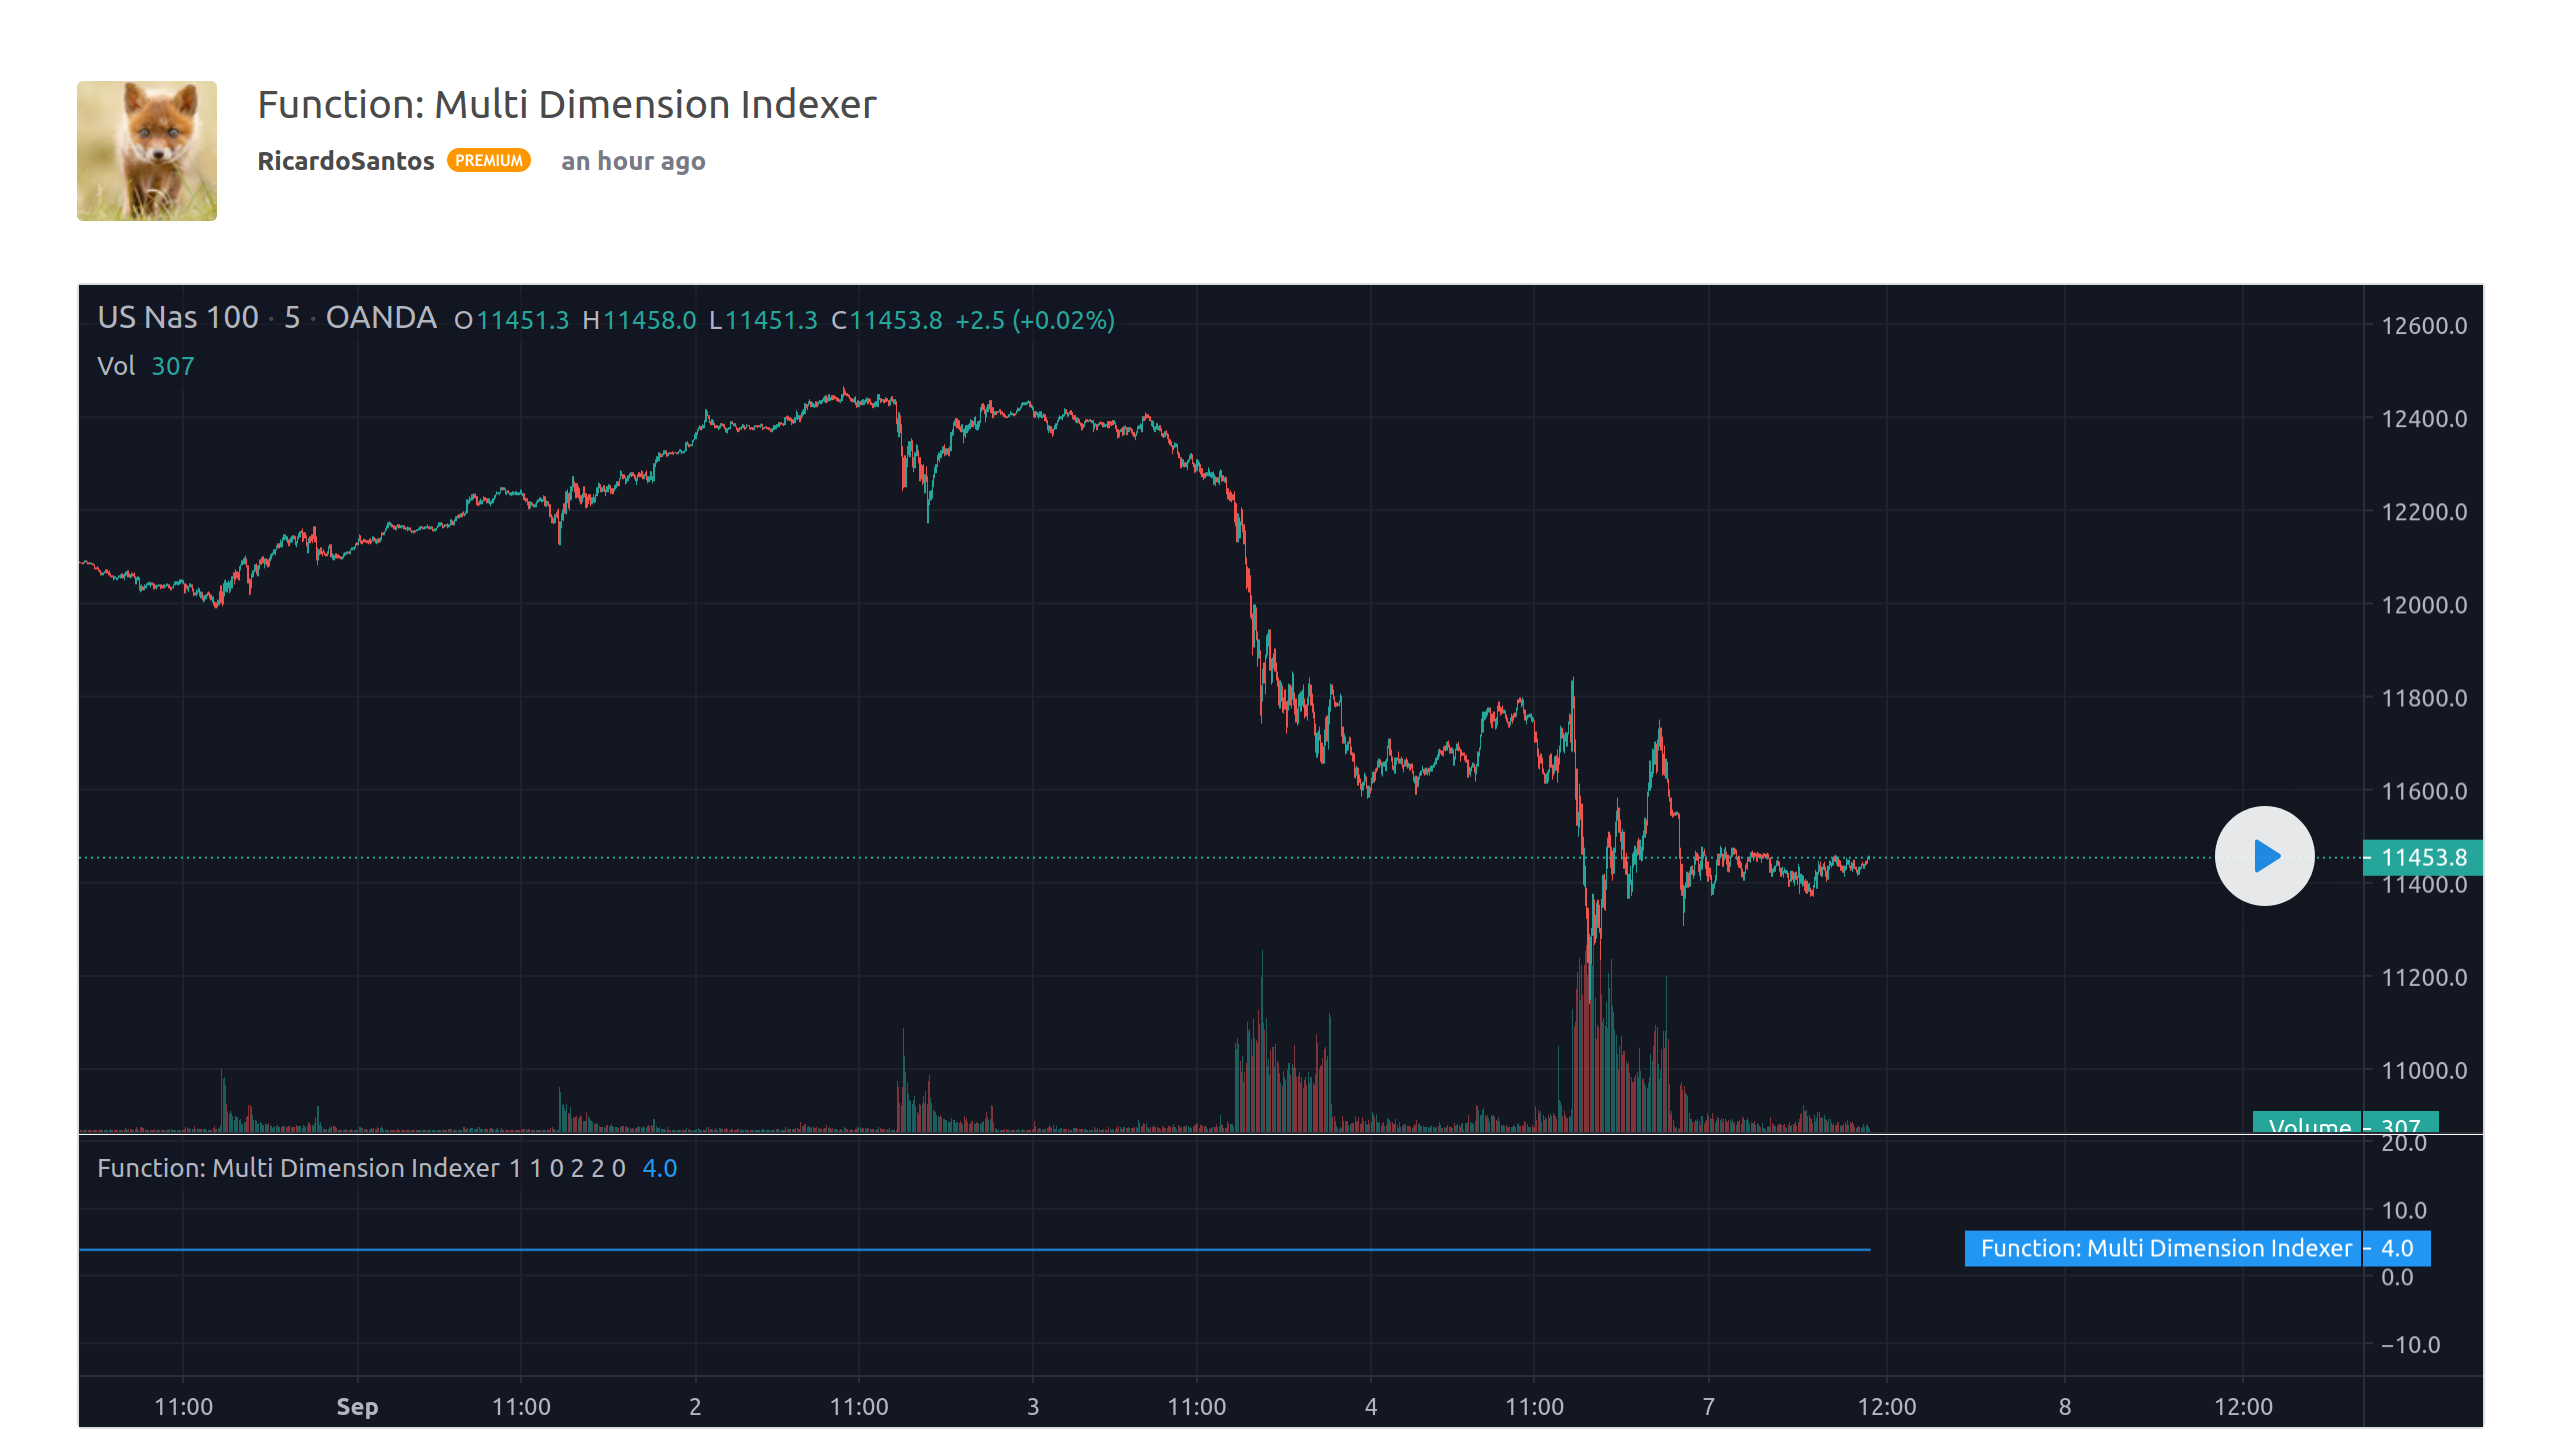
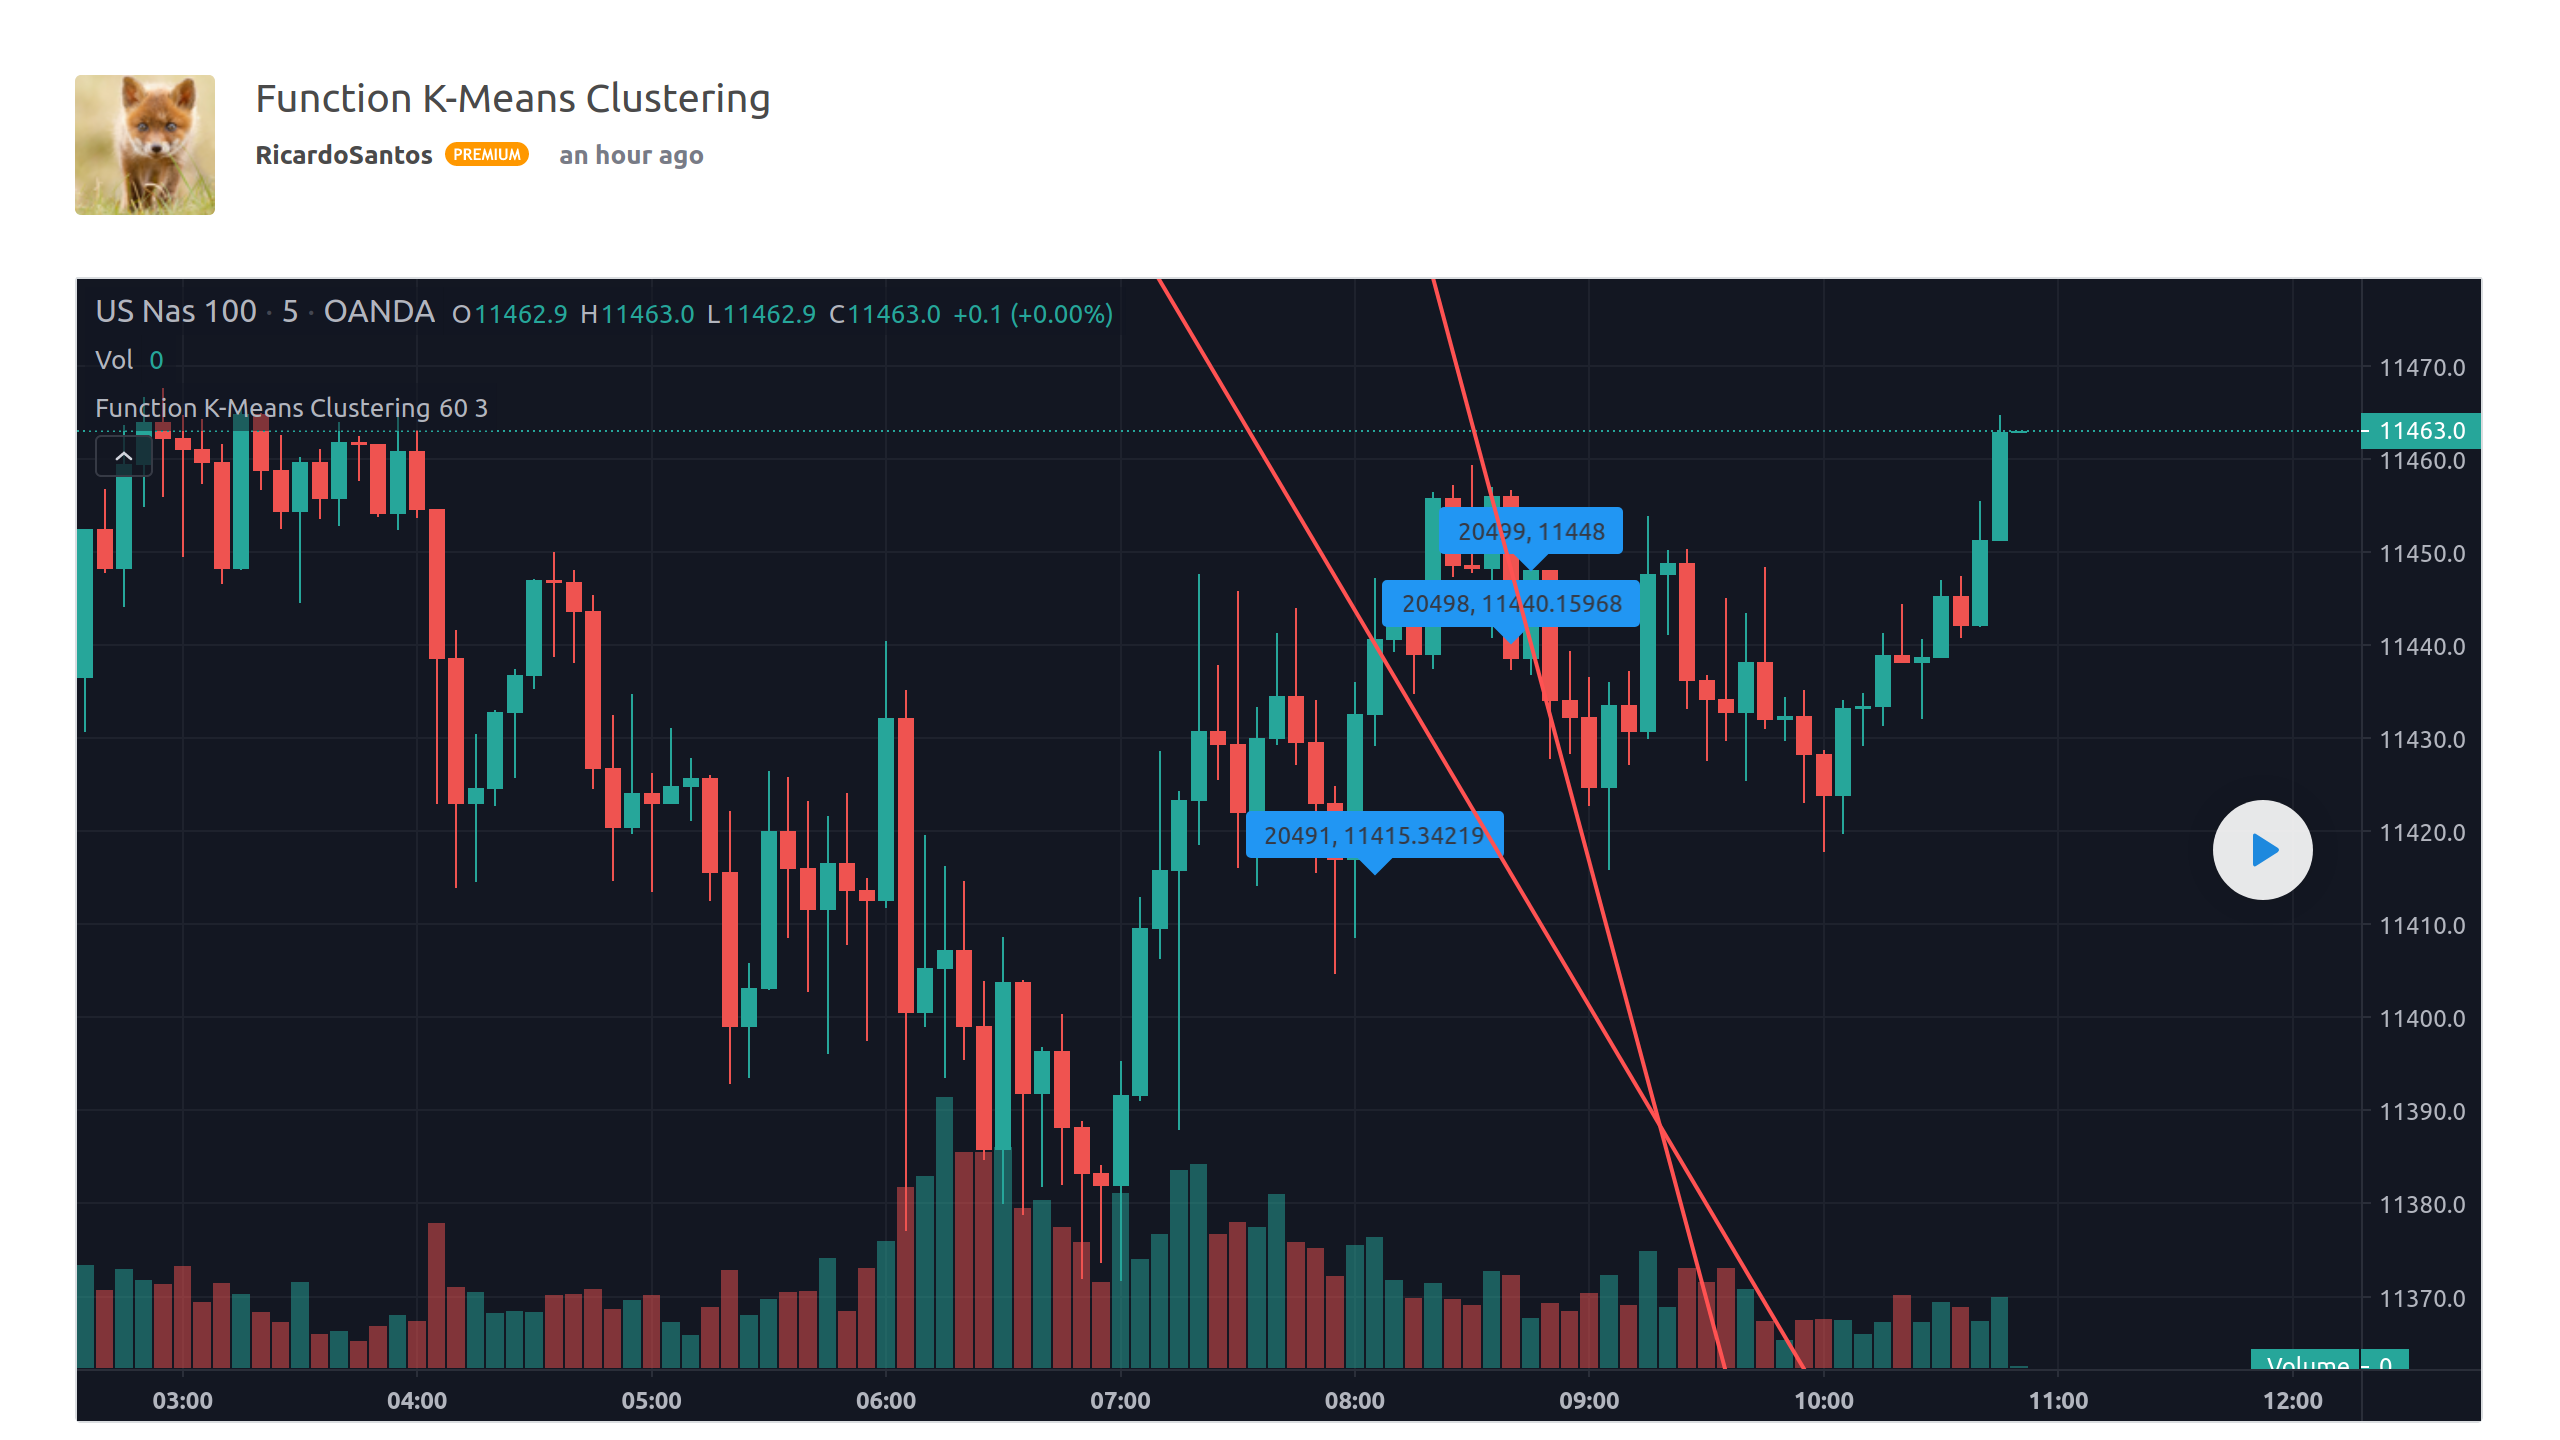
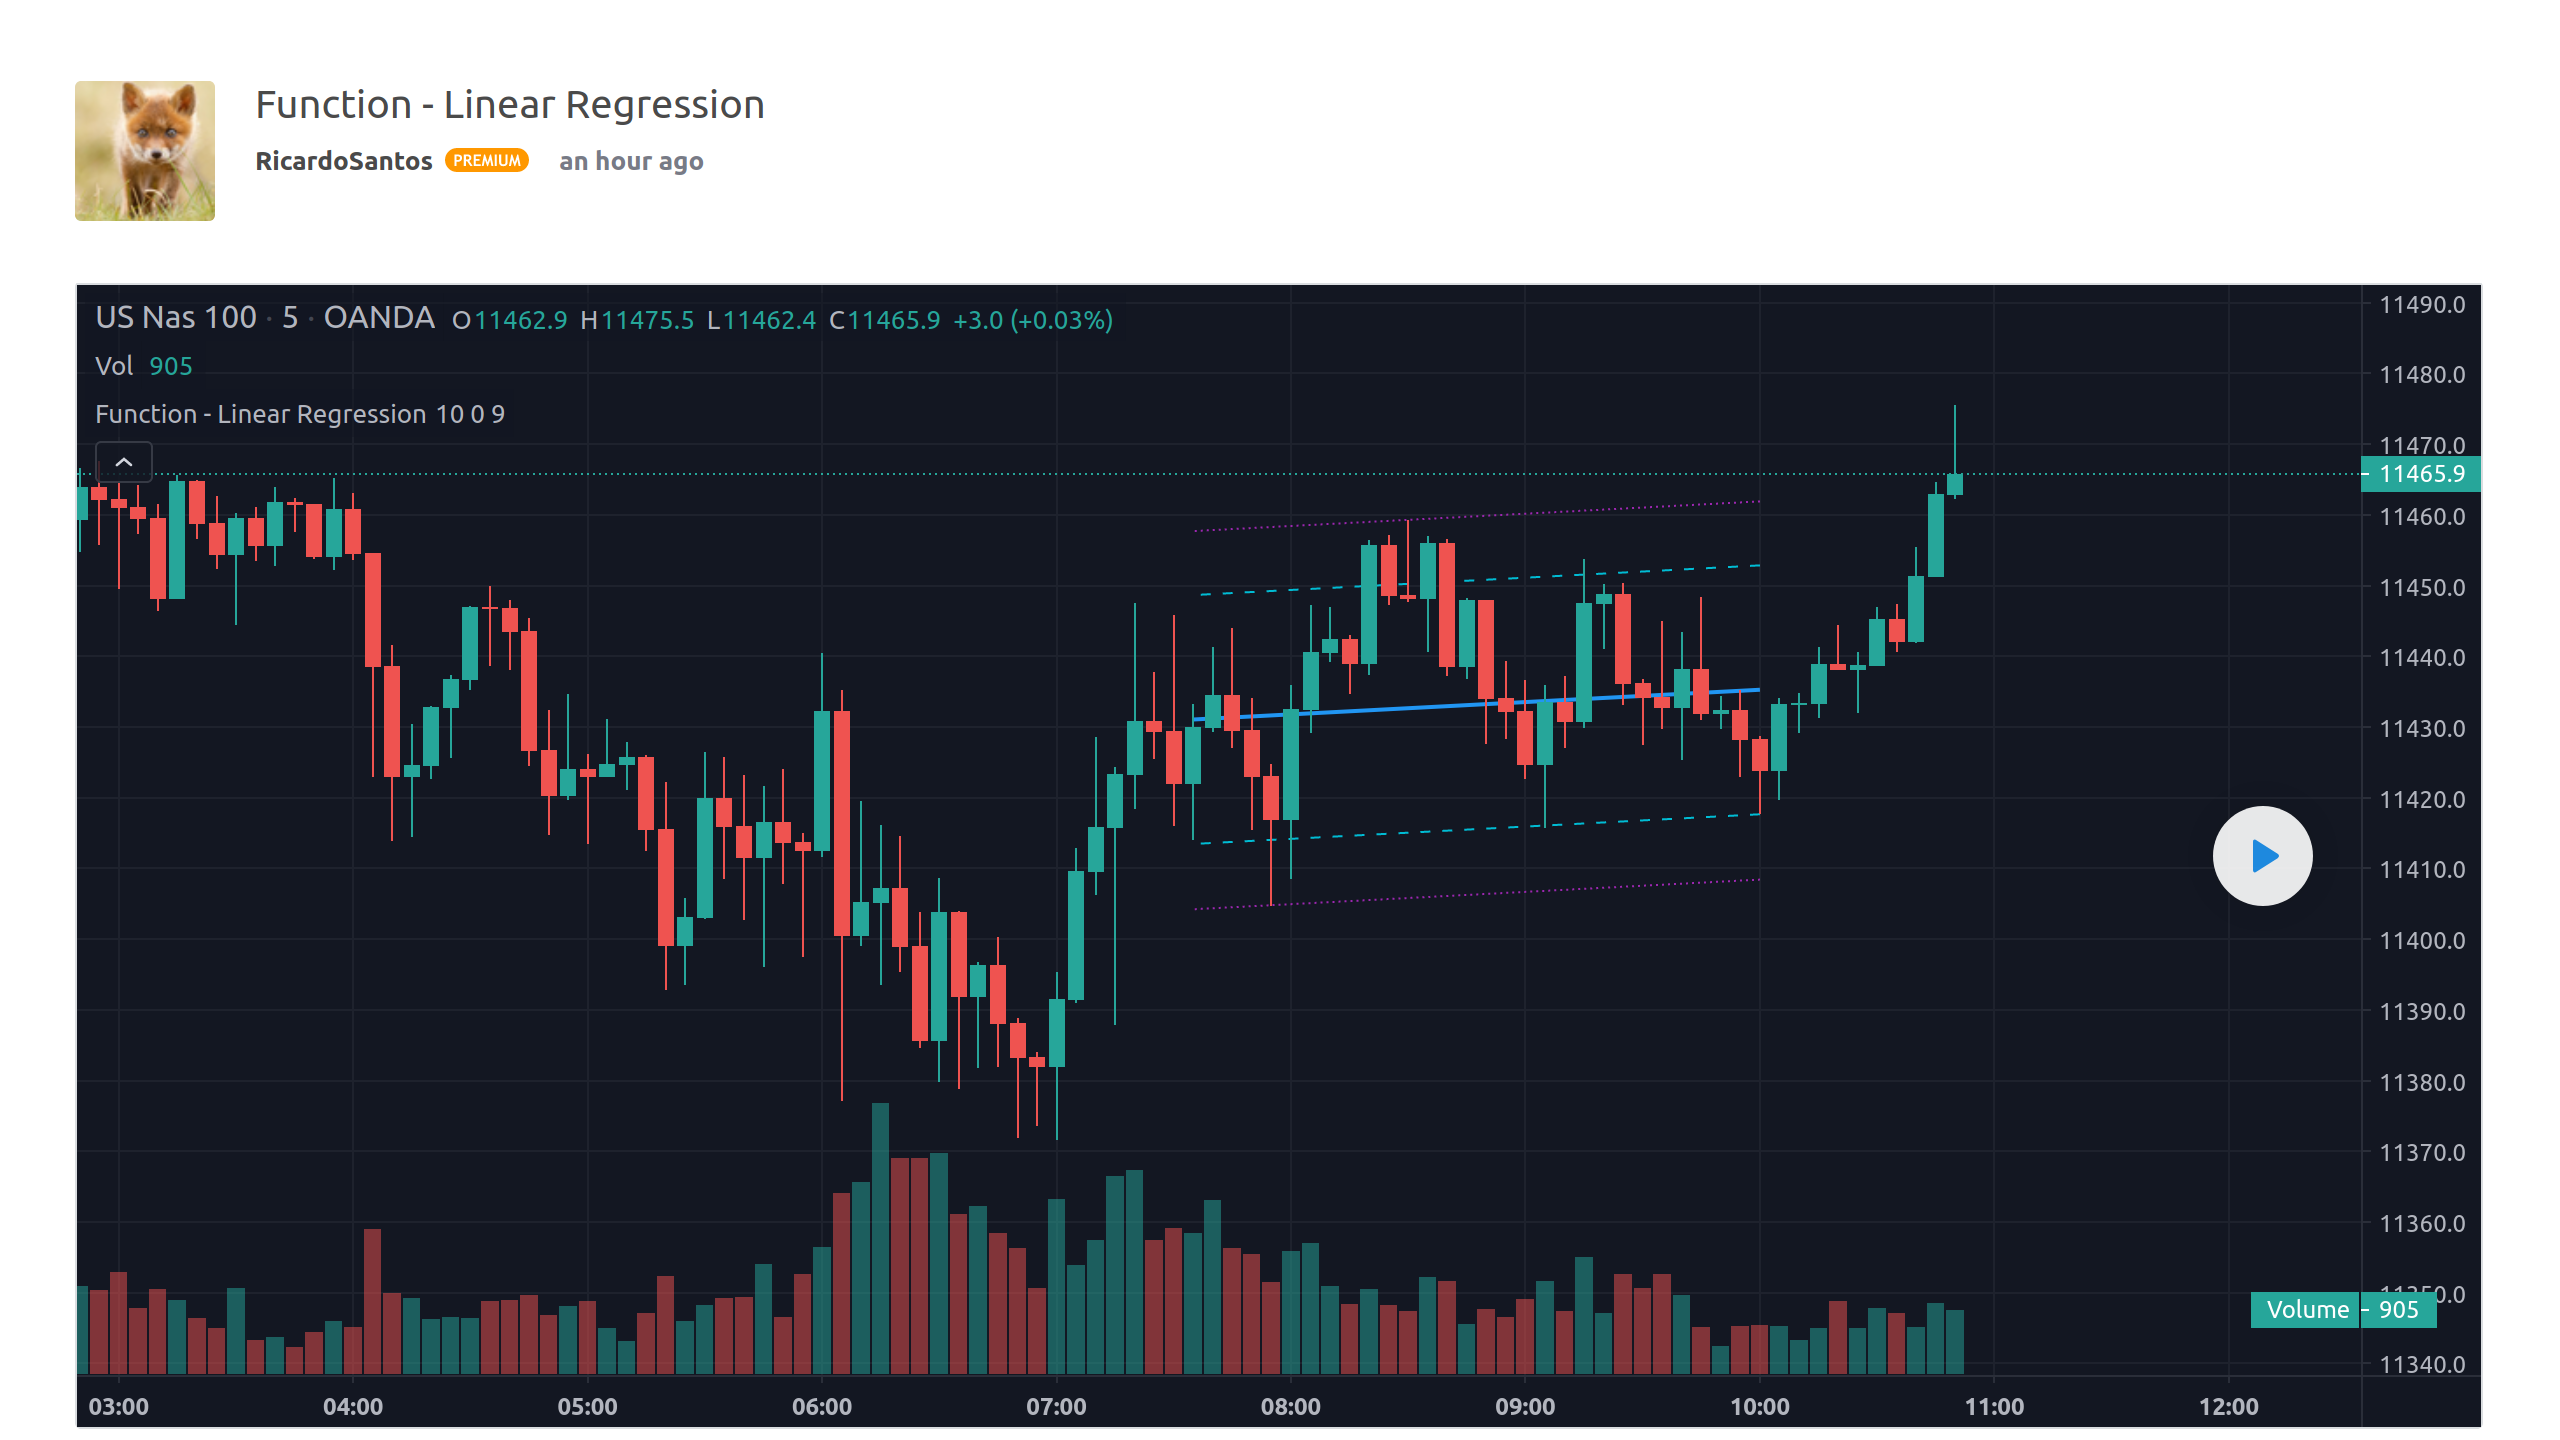
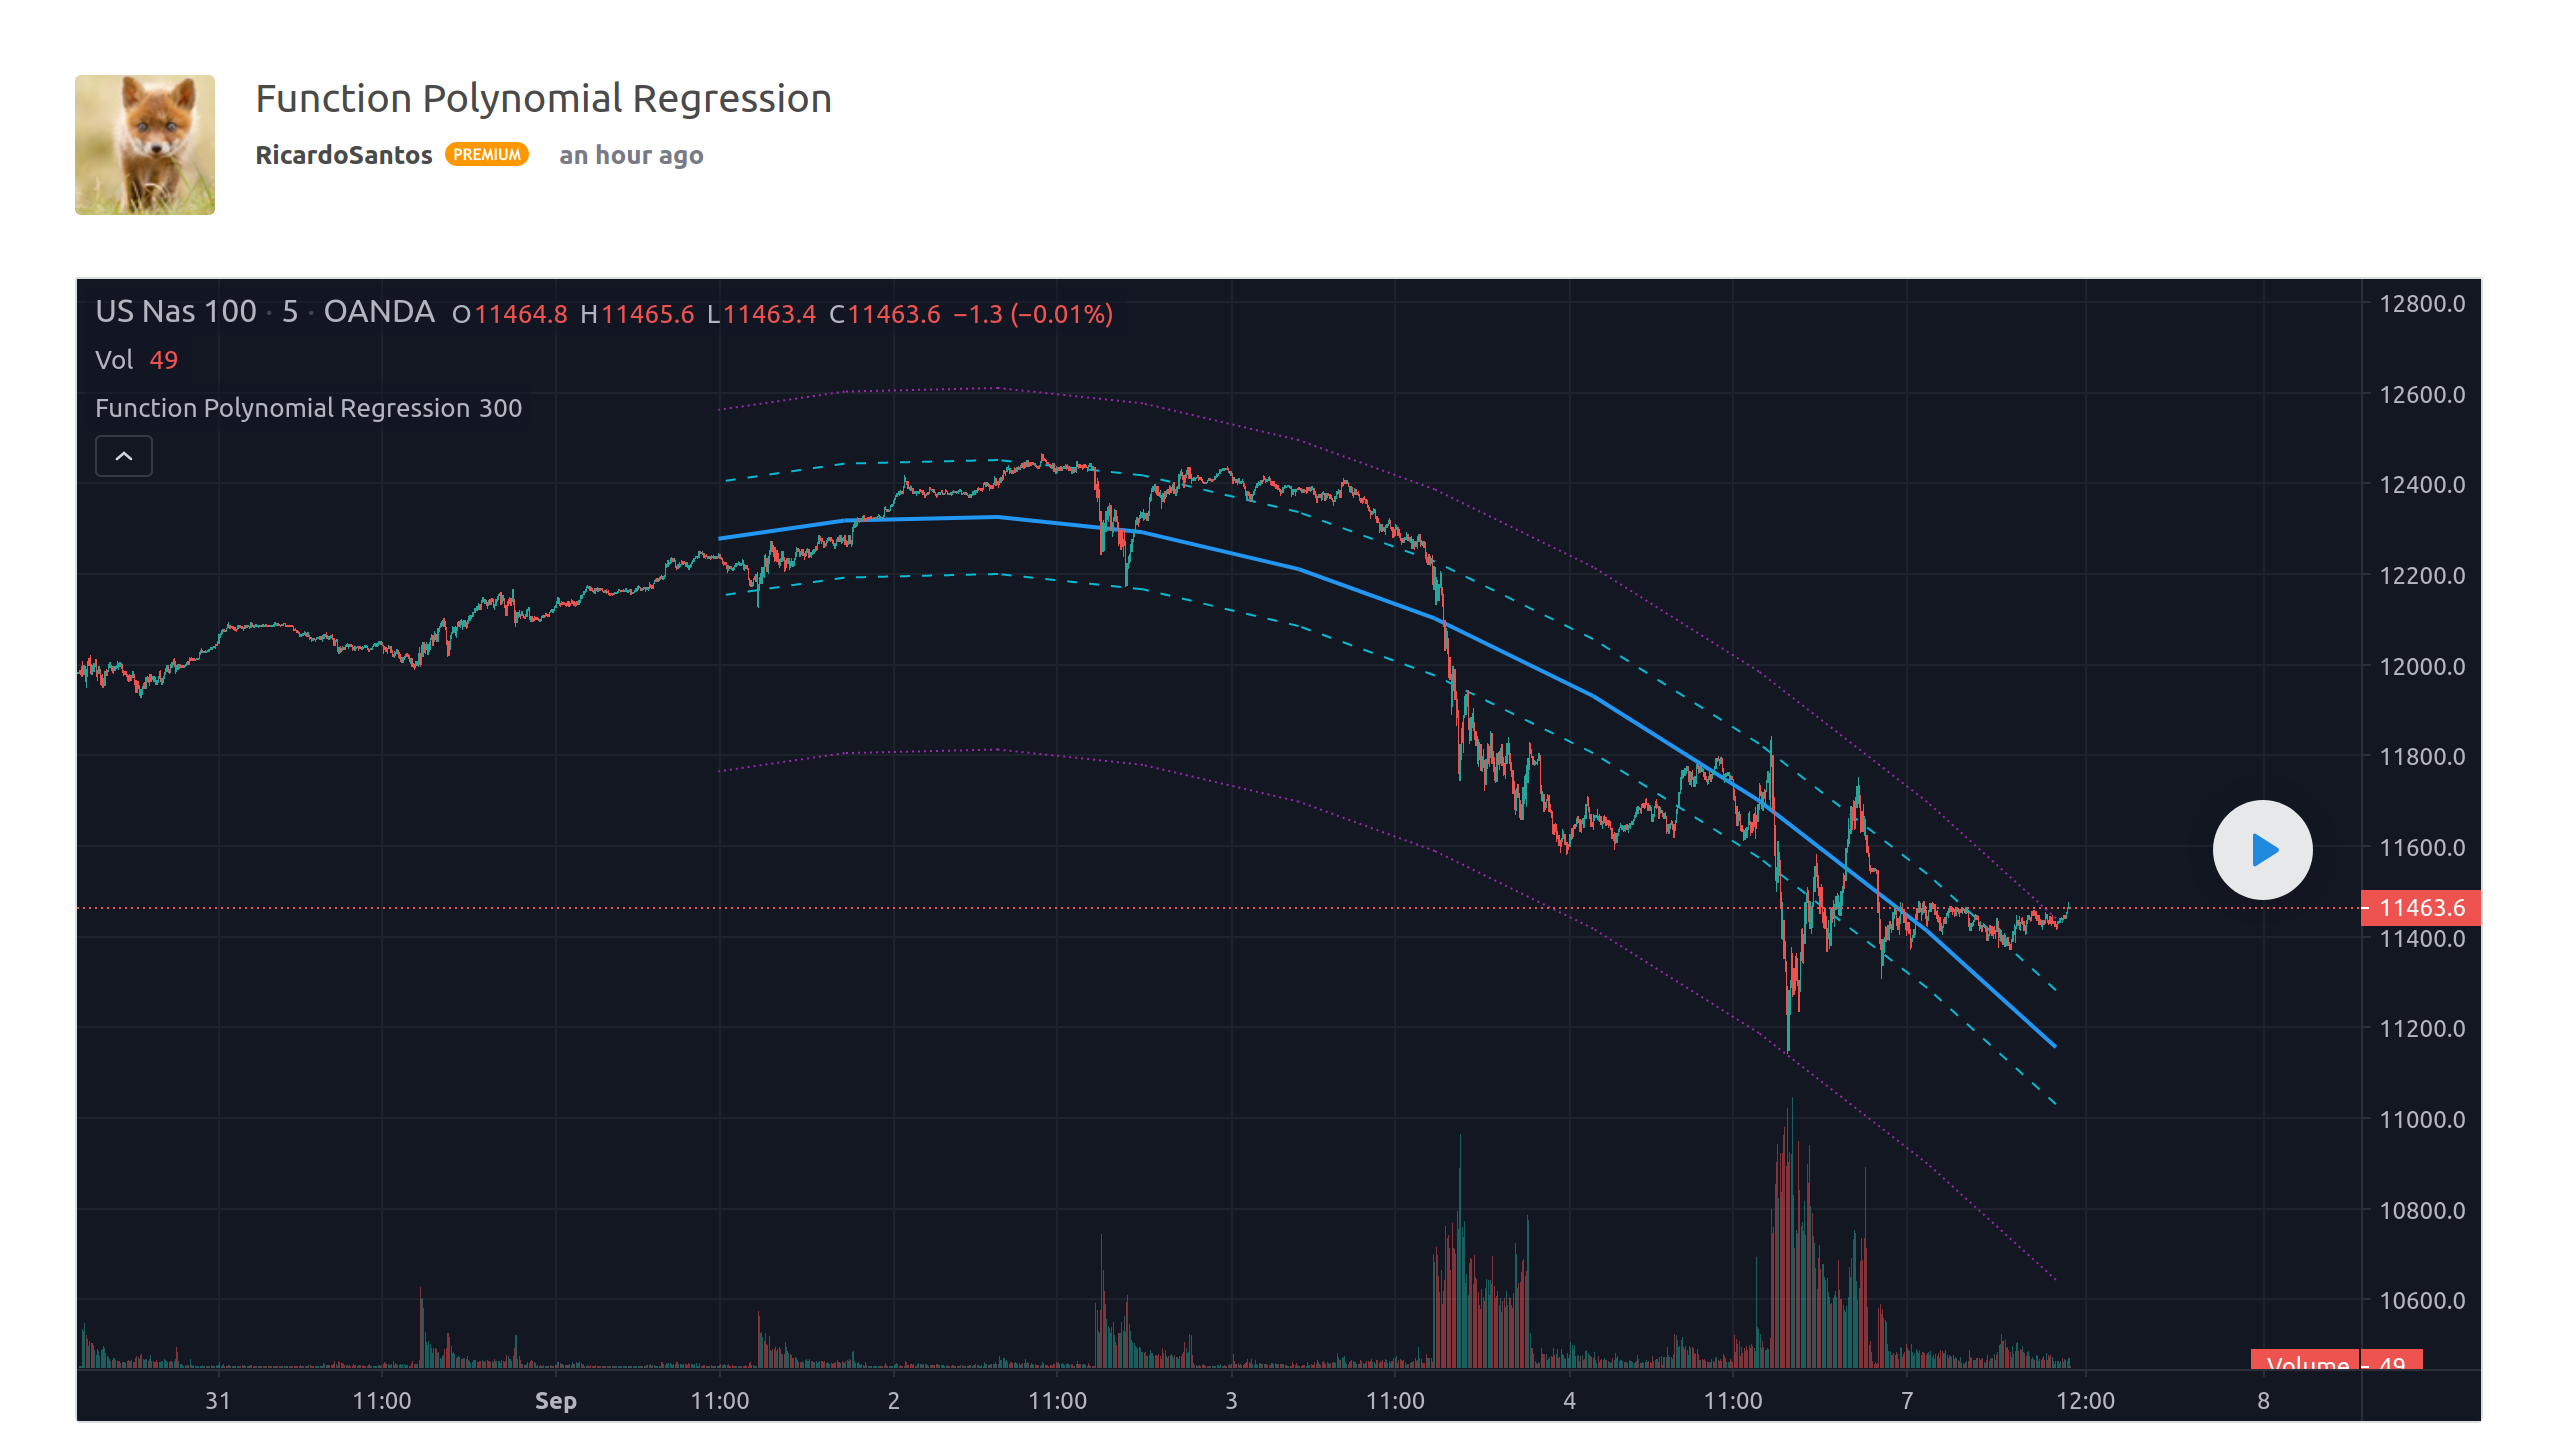
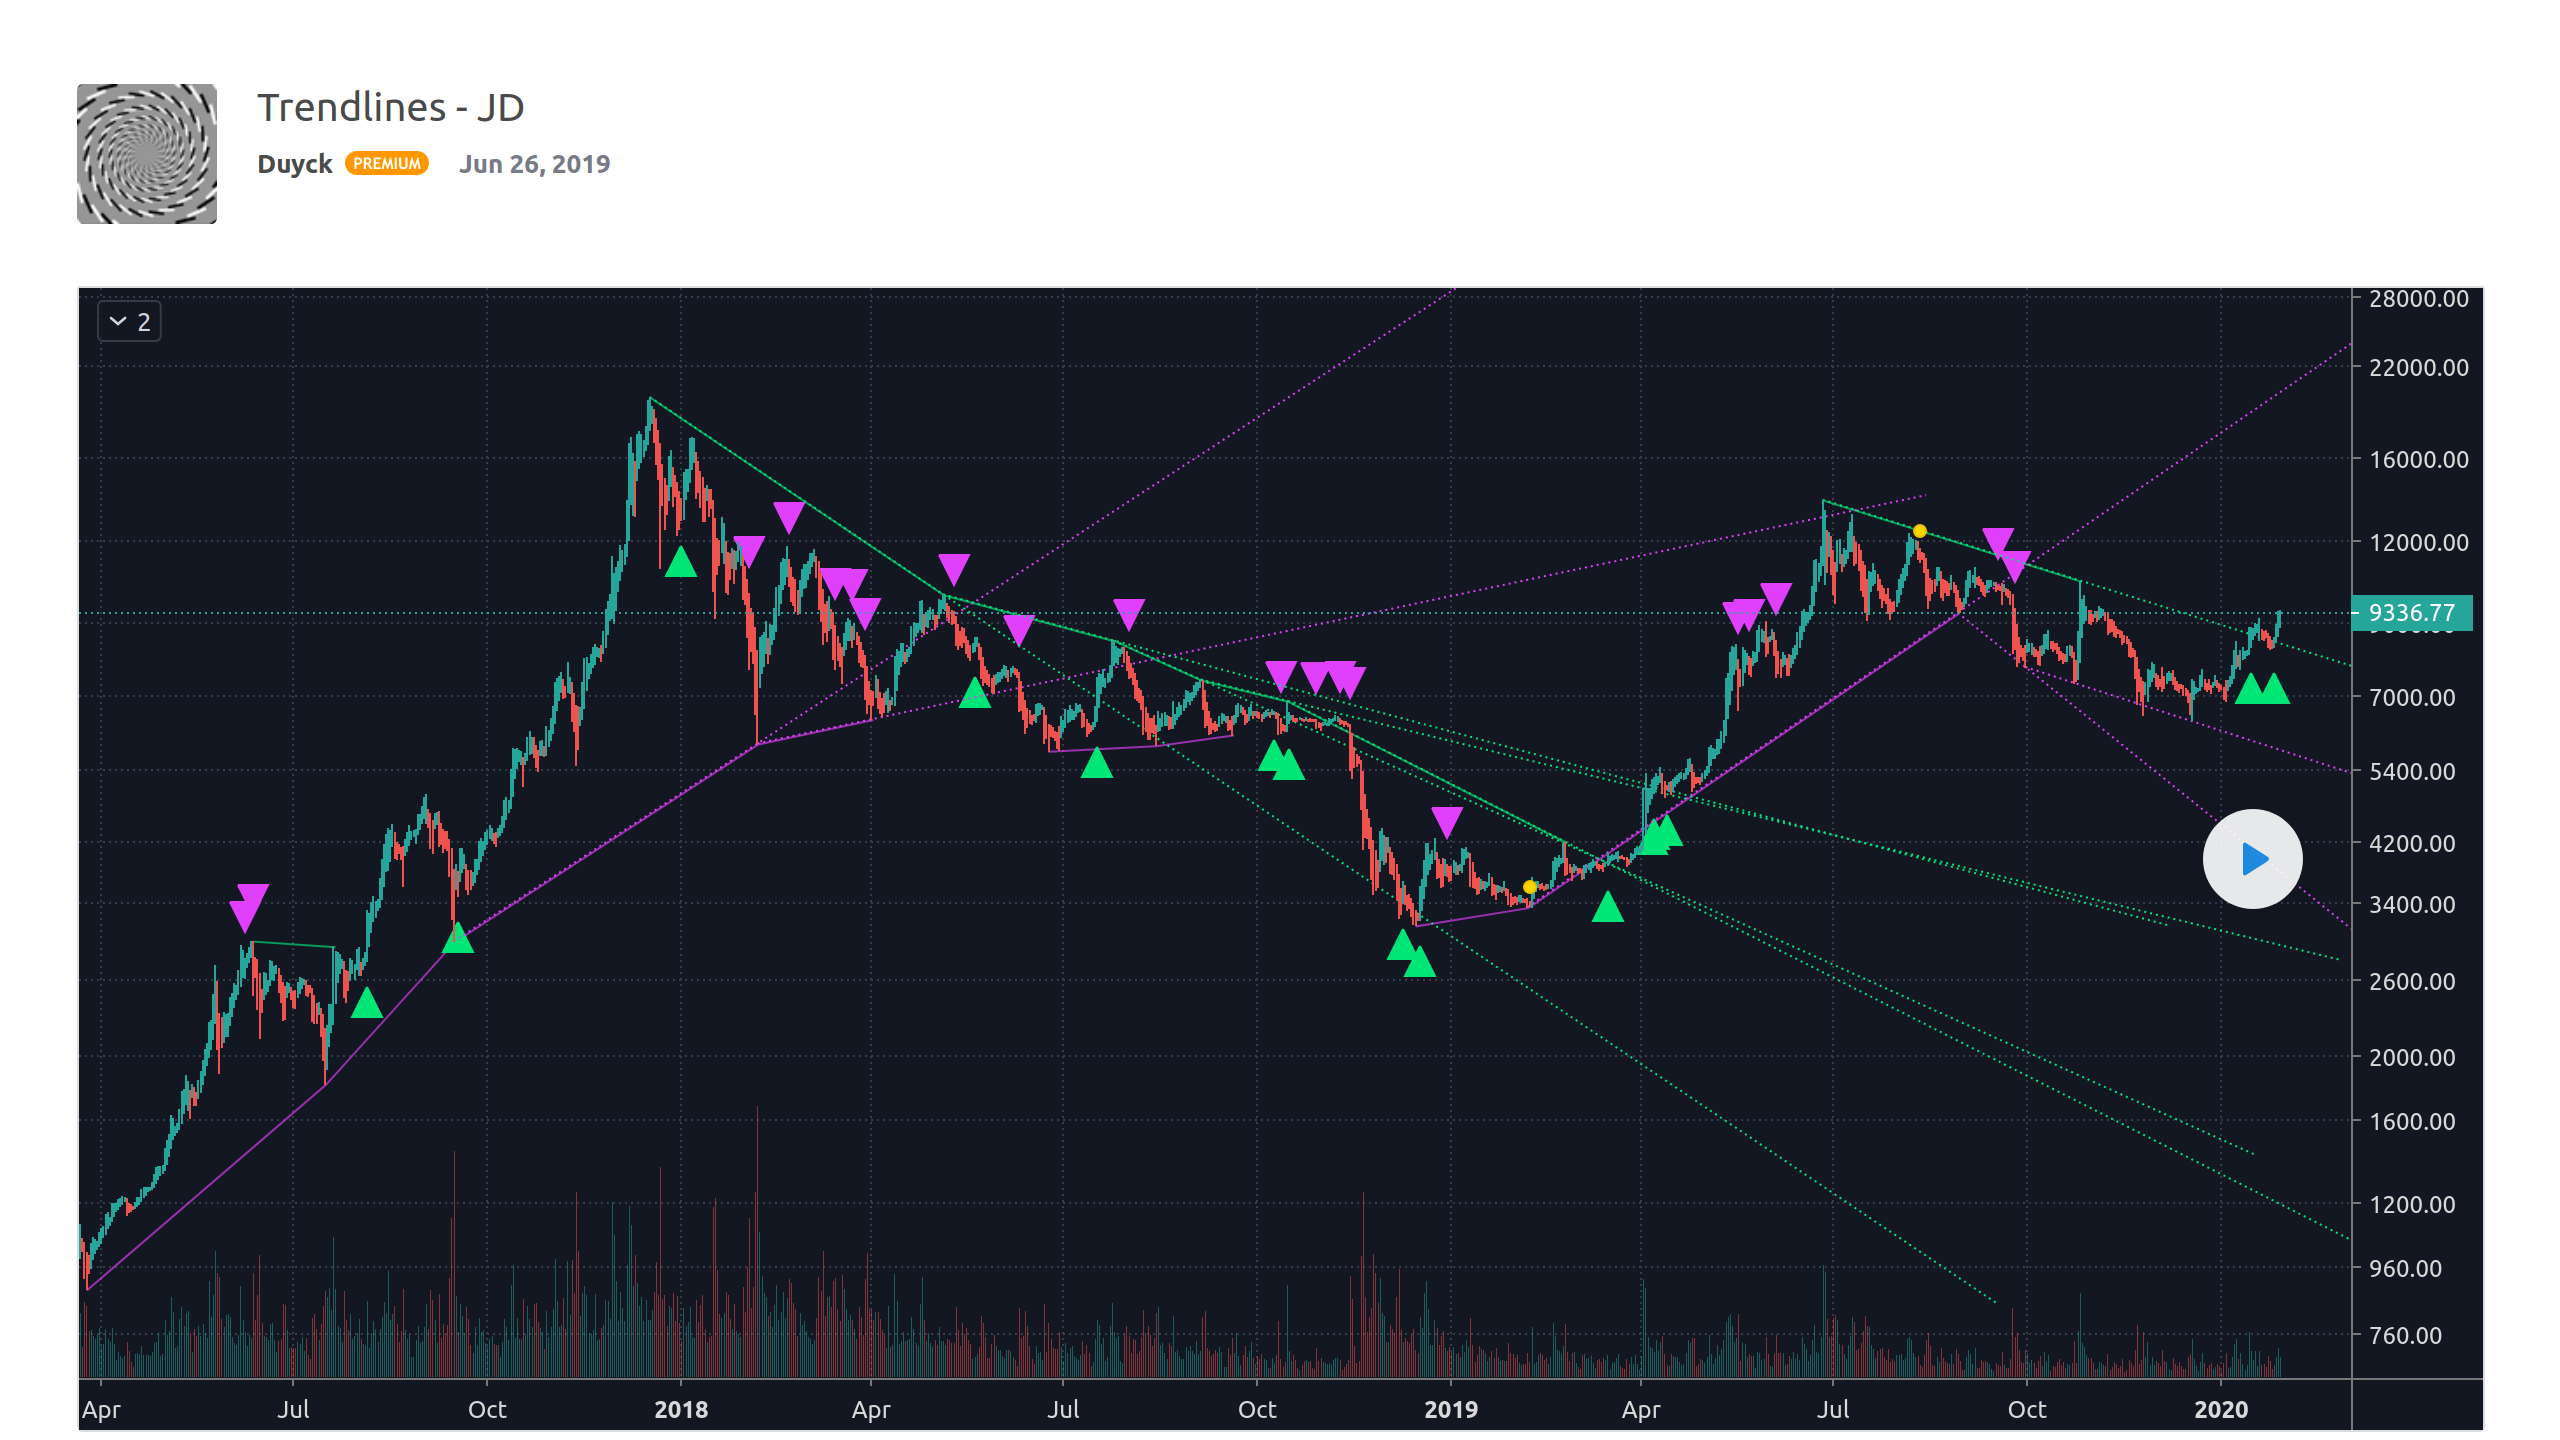
Pine用戶手冊的陣列章節將幫助您入門。另外,請參閱PineCoders在這些腳本中發揮作用的陣列,他們在測試陣列方面為我們提供了最大幫助,我們由衷地感謝:RicardoSantos 和 Duyck:
Graph style – 4th Dimension RSI
Function – Multi Dimension Indexer
Function – Polynomial Regression
這些腳本讓我們看見了陣列如何重新定義Pine的可能性,以及它們如何為所有TradingView交易者提供比以往更強大的指標和策略。我們喜歡看到它。
我們希望您請求的這項新功能有用。請繼續向我們發送您的反饋以進行改善。我們為您建構TradingView,並希望聽聽您對我們平台上這些迫切要求的更新之看法。