我們的新快訊使用`alert()`函數,該函數可在策略和研究中使用,並允許在快訊觸發時生成完全動態的訊息。
新快訊使用類似於最近策略快訊的模型工作,在該模型中,只有在圖表用戶介面中建立的一個快訊才能聚合腳本中任意數量的`alert()`調用生成的所有觸發器。單一策略快訊將匯總所有經紀商事件觸發器。
要建立新快訊:
- 根據需要在腳本中包含盡可能多的`alert()`調用,並將每個調用都包含在定義觸發條件的`if` block中。
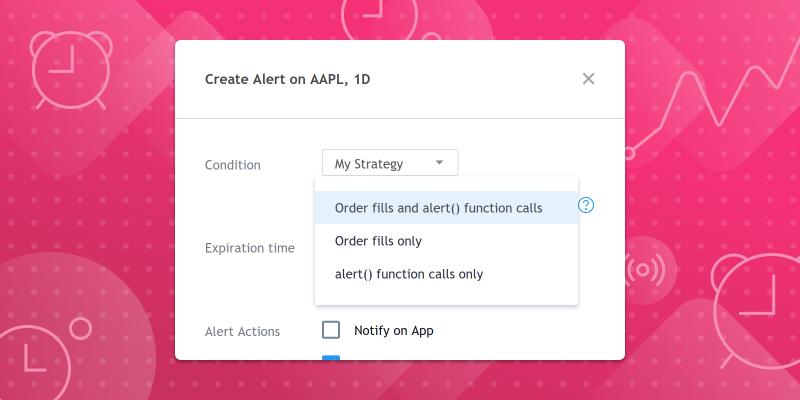
- 使用圖表的“建立快訊”對話框為腳本建立一個快訊,然後選擇一種快訊類型,包括“ alert()函數調用”。
在策略中使用時,用戶可以選擇建立僅在`alert()`事件、訂單執行事件或兩者上觸發的快訊。還需要記住的是,動態快訊訊息中可以使用的變數數量沒有限制,並且不再需要佔位符,因為腳本中使用的任何變數也可以在新的`alert()`函數調用中使用,只要它採用字串格式即可。
以下是`alert()`函數的三個示例:
1) 每個K線上都會觸發腳本快訊,並且訊息中包含該K線的收盤價:
//@version=4
study("Simple alert() example")
plot(close)
alert("Close = " + tostring(close), alert.freq_once_per_bar_close)
2) 檢查三個指標的值:RSI、SMA、和動量。如果任何指標超過指定水平(或價格),都會觸發腳本快訊,並且訊息中將包含指標名稱及其當前值。
//@version=4
study("alert() with multiple indicators", overlay=true)
f_triggerSma()=>
    _s  = sma(close, 14)
    _co = crossover(close, _s)
    _cu = crossunder(close, _s)
    if _co
        alert("Price (" + tostring(close) + ") crossing up SMA (" + tostring(_s) + ")", alert.freq_once_per_bar)
    else if _cu
        alert("Price (" + tostring(close) + ") crossing down SMA (" + tostring(_s) + ")", alert.freq_once_per_bar)
f_triggerRsi()=>
    _r  = rsi(close, 7)
    _co = crossover(_r, 70)
    _cu = crossunder(_r, 30)
    if _co
        alert("RSI (" + tostring(_r) + ") crossing up 70 level", alert.freq_once_per_bar)
    else if _cu
        alert("RSI (" + tostring(_r) + ") crossing down 30 level", alert.freq_once_per_bar)
f_triggerMom()=>
    _m  = mom(close, 14)
    _co = crossover(_m, 0)
    _cu = crossunder(_m, 0)
    if _co
        alert("Momentum (" + tostring(_m) + ")  crossing up 0 level", alert.freq_once_per_bar)
    else if _cu
        alert("Momentum (" + tostring(_m) + ")  crossing down 0 level", alert.freq_once_per_bar)

plot(sma(close, 14), "SMA")
f_triggerSma()
f_triggerRsi()
f_triggerMom()
3) 在此示例中,檢查了一個RSI指標的值,但一次檢查了五個商品代碼。如果RSI交叉任何商品代碼的指定級別,將觸發腳本快訊,並且訊息將在交叉時包含商品和指標值。
//@version=4
study("alert() with multiple symbols")
f_triggerRsi(_ticker)=>
    _r = rsi(close, 7)
    _x = crossover(_r,70)
    _y = crossunder(_r,30)
    _rt = barstate.isrealtime
    [_rsi, _co, _cu, _rt_bar] = security(_ticker, timeframe.period, [_r, _x, _y, _rt])
    _msg = _ticker + ", " + timeframe.period + ": "
    if _co and _rt_bar
        _msg := _msg + "RSI (" + tostring(_rsi) + ") crossing up 70 level"
        alert(_msg,  alert.freq_once_per_bar_close)
    else if _cu and _rt_bar
        _msg := _msg + "RSI (" + tostring(_rsi) + ")  crossing down 30 level"
        alert(_msg,  alert.freq_once_per_bar_close)

plot(rsi(close, 7), "RSI", color=#8E1599)
band1 = hline(70, "Upper Band", color=#C0C0C0)
band0 = hline(30, "Lower Band", color=#C0C0C0)
fill(band1, band0, color=color.new(#9915FF,90), title="Background")

f_triggerRsi(syminfo.tickerid)
f_triggerRsi("NASDAQ:MSFT")
f_triggerRsi("FX:EURUSD")
f_triggerRsi("NASDAQ:TSLA")
f_triggerRsi("NASDAQ:PYPL")
腳本用戶可以在幫助中心了解有關建立快訊的更多資訊。Pine編碼人員可以在Pine用戶手冊 和參考手冊中閱讀有關新快訊的資訊。
在我們用戶手冊的發行說明中閱讀有關Pine的所有更新。