
Market Pressure says:
Sector ratios say:
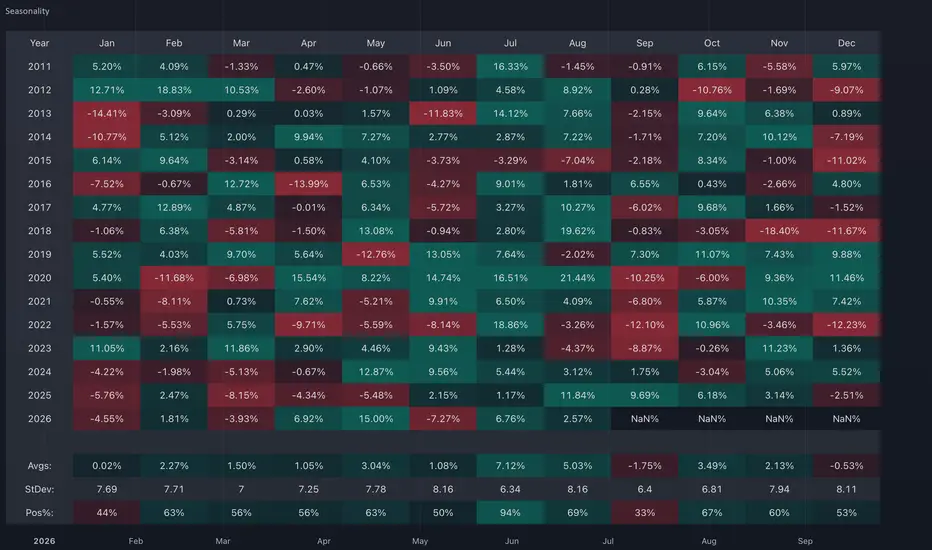
Seasonality says:
September is historically vulnerable, but October–November become materially better. Together, that produces a very useful roadmap.
The key scenario for 2026
The historically interesting path would now be:
September seasonal weakness
→ breadth washout
→ volatility finally reaches Stress
→ panic fails
→ internals reverse
→ October recovery
→ November momentum continuation
We should not assume that sequence will happen.
But the first stages are becoming increasingly plausible because the internal deterioration already exists.
There is also a bullish alternative:
Friday's strong advancing volume could mark the beginning of a repair before full Stress ever develops.
If Nasdaq new lows collapse from 164 and breadth reverses upward from 20–25%, the market could front-run the historically strong October period.
That's why waiting mechanically for October would also be a mistake.
TradeSentinel Takeaway
The seasonal table gives this week's deterioration more context:
September historically has the weakest remaining midterm-year profile — and 2026 enters it with breadth, leadership and volatility already moving in the wrong direction.
But the more valuable seasonal insight may be what follows.
So the objective is not to predict a September correction.
>> It is to watch whether the current deterioration produces the washout → stress failure → breadth recovery sequence that could make the historically strong October–November period actionable. <<
And right now, with breadth near 20–25%, Nasdaq new lows at 164, and volatility finally starting to rise, we are getting closer to the part of the process where the reversal signals become more important than the deterioration itself.
- Deterioration approaching Stress
- breadth near washout territory
- long-term breadth <60%
- new lows surging
- volatility beginning to rise
- Sector performance says:
- Leadership is narrowing
- Energy strongest
- Financials/Technology retain structure
- Healthcare and Materials cooling
- broad momentum opportunity set shrinking
Sector ratios say:
- Concentration is increasing
- Energy / Technology / Software still lead
- RSP weak
- QQQE weak versus QQQ
- small caps weak
- VIX/VVIX relative strength increasing
Seasonality says:
September is historically vulnerable, but October–November become materially better. Together, that produces a very useful roadmap.
The key scenario for 2026
The historically interesting path would now be:
September seasonal weakness
→ breadth washout
→ volatility finally reaches Stress
→ panic fails
→ internals reverse
→ October recovery
→ November momentum continuation
We should not assume that sequence will happen.
But the first stages are becoming increasingly plausible because the internal deterioration already exists.
There is also a bullish alternative:
Friday's strong advancing volume could mark the beginning of a repair before full Stress ever develops.
If Nasdaq new lows collapse from 164 and breadth reverses upward from 20–25%, the market could front-run the historically strong October period.
That's why waiting mechanically for October would also be a mistake.
TradeSentinel Takeaway
The seasonal table gives this week's deterioration more context:
September historically has the weakest remaining midterm-year profile — and 2026 enters it with breadth, leadership and volatility already moving in the wrong direction.
But the more valuable seasonal insight may be what follows.
- September is the risk window.
- October is the potential reversal window.
- November is the cleaner momentum window.
So the objective is not to predict a September correction.
>> It is to watch whether the current deterioration produces the washout → stress failure → breadth recovery sequence that could make the historically strong October–November period actionable. <<
And right now, with breadth near 20–25%, Nasdaq new lows at 164, and volatility finally starting to rise, we are getting closer to the part of the process where the reversal signals become more important than the deterioration itself.

You don’t have an information problem. You have a decision problem. TradeSentinel helps to fix it.
📈 Custom Indicators
𝕏 More insights, guidance & links
🤖 AI features via 𝕏 and ChatGPT
🤑 Founding Member Price
🌐 tradesentinel.app
❗ Boost/comment
📈 Custom Indicators
𝕏 More insights, guidance & links
🤖 AI features via 𝕏 and ChatGPT
🤑 Founding Member Price
🌐 tradesentinel.app
❗ Boost/comment
Related publications
Disclaimer
The information and publications are not meant to be, and do not constitute, financial, investment, trading, or other types of advice or recommendations supplied or endorsed by TradingView. Read more in the Terms of Use.