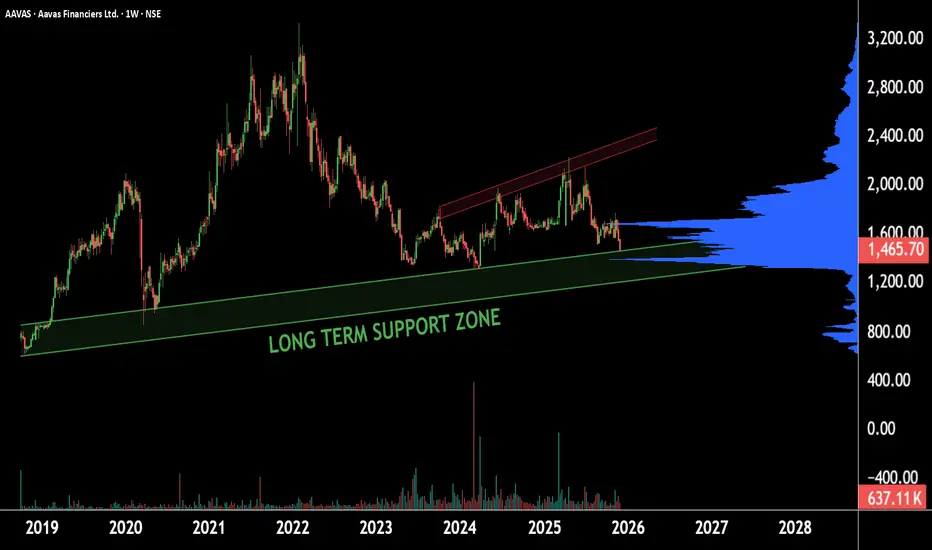
This is the weekly timeframe chart of AAVAS.
The stock is currently trending near its long-term support zone of ₹1400–₹1200.
The volume indicator also suggests significant accumulation around the ₹1350 range.
This zone acts as a major demand area, and the stock is likely to attempt a reversal from this region.
Thank you.
The stock is currently trending near its long-term support zone of ₹1400–₹1200.
The volume indicator also suggests significant accumulation around the ₹1350 range.
This zone acts as a major demand area, and the stock is likely to attempt a reversal from this region.
Thank you.
@RahulSaraoge
Connect us at t.me/stridesadvisory
Connect us at t.me/stridesadvisory
Disclaimer
The information and publications are not meant to be, and do not constitute, financial, investment, trading, or other types of advice or recommendations supplied or endorsed by TradingView. Read more in the Terms of Use.