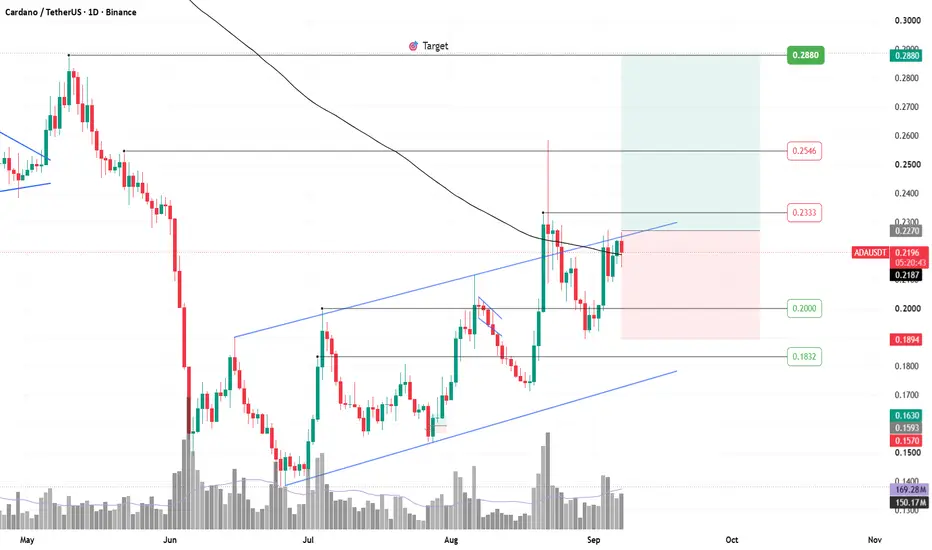

 ADAUSDT is trading within a rising channel and has recently moved back toward the upper boundary of the structure.
Price is now testing the 200-day SMA, located around 0.2270. This moving average is acting as a major dynamic resistance, so a confirmed daily close above it is needed to validate the breakout and support further upside.
## Key levels
Critical 200-day SMA / breakout area: 0.2270
First resistance: 0.2333
Second resistance: 0.2546
Main target: 0.2880
Key support: 0.2000
Lower support: 0.1832
Stop loss: 0.1894
Bullish scenario
A sustained close above the 200-day SMA would confirm that ADAUSDT is breaking above the immediate resistance area while maintaining its ascending-channel structure.
If buyers hold price above 0.2270, the first level to watch is 0.2333. A successful breakout above this resistance could allow the price to continue toward 0.2546, with the main target located near 0.2880.
The ascending channel remains constructive as long as price continues to form higher lows and respects the highlighted support zones.
Risk scenario
Failure to close above the 200-day SMA could lead to another rejection from the current resistance area.
In that case, 0.2000 is the first important support to monitor, followed by 0.1832. A daily breakdown below the stop-loss level at 0.1894 would invalidate this bullish setup.
Not an advice to buy or sell, make your own analysis, and always use proper risk management.

Disclaimer
The information and publications are not meant to be, and do not constitute, financial, investment, trading, or other types of advice or recommendations supplied or endorsed by TradingView. Read more in the Terms of Use.
Disclaimer
The information and publications are not meant to be, and do not constitute, financial, investment, trading, or other types of advice or recommendations supplied or endorsed by TradingView. Read more in the Terms of Use.