
Hello, traders.
Thank you for following my analysis.
If you "Follow" me, you'll be able to receive new market updates as quickly as possible.
Wishing you successful trading today.
==================================================
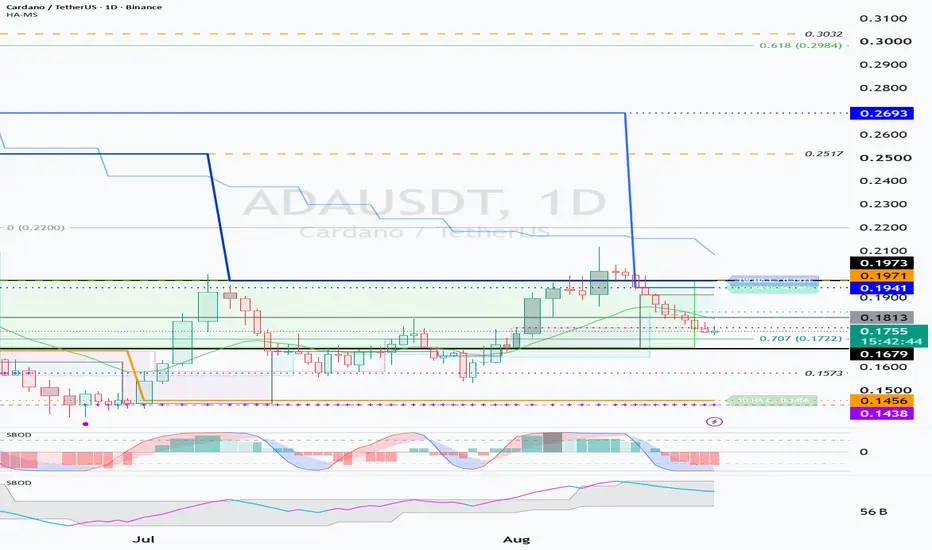
[ ADA KEY PRICE LEVELS ]
* Key Zone: 0.1679 ~ 0.1973
* Key Volume Profile Level: 0.1813
* Upper Breakout / Support Confirmation: Around 0.1973
* Lower Breakdown Level: 0.1679
==================================================
ADA moved above 0.1971 but failed to establish support above that level and is now facing renewed downside pressure.
The most important price zone to watch is:
> > > 0.1679 ~ 0.1973
This zone is likely to play a major role in determining ADA's short-term direction.
If the current weakness continues, price may eventually retest the lower boundary around 0.1679.
However, before that happens, there is another important level to watch:
> > > Volume Profile: 0.1813
The 0.1813 level is a key volume profile level located inside the current major price zone.
Therefore, if ADA rebounds, the important question is not simply whether price moves higher, but:
"Can ADA break above 0.1813 and successfully flip it into support?"
In other words:
0.1813 Breakout
↓
Retest Around 0.1813
↓
Support Confirmation
↓
Higher Probability of Further Upside
This is the price structure we need to watch for.
On the other hand, if ADA fails to reclaim 0.1813, downside pressure toward 0.1679 may increase again.
==================================================
[ WHERE SHOULD WE START SCALING INTO TRADES? ]
==============================================
One of the most difficult decisions in trading is determining:
"Which price levels should be used for scaling in and scaling out?"
Simply buying because price has fallen significantly or selling because price has risen significantly does not provide a reliable trading framework.
We need objective reference levels that help identify potential low and high zones.
==================================================
[ 1. LOW ZONE: DOM(-60) / HA-Low ]
==================================
My chart includes indicators designed to identify potential low and high zones.
The primary indicators used to identify potential low zones are:
> > > DOM(-60)
> > > HA-Low
When price declines, we should first monitor whether either of these indicators begins to form.
The basic sequence is:
Price Decline
↓
DOM(-60) or HA-Low Formation
↓
Price Tests the Level
↓
Support Confirmation
The appearance of DOM(-60) or HA-Low alone does not mean that we should immediately buy.
What matters is whether:
"Actual buying pressure enters the market and establishes support around that level."
==================================================
[ 2. HIGH ZONE: DOM(60) / HA-High ]
===================================
The primary indicators used to identify potential high zones are:
> > > DOM(60)
> > > HA-High
When price rises toward DOM(60) or HA-High, that area can be considered a potential High Zone where short-term selling pressure may increase.
Therefore:
DOM(-60) / HA-Low
= Potential Low Zone + Support Confirmation Area
DOM(60) / HA-High
= Potential High Zone + Resistance Confirmation Area
These indicators can serve as key reference points for a basic trading strategy.
Whenever price approaches one of these levels, we need to carefully monitor the price reaction.
==================================================
[ 3. StochRSI 20 / 50 / 80 ]
============================
The next indicators that can be used for short-term trading decisions are:
> > > StochRSI 20
> > > StochRSI 50
> > > StochRSI 80
These levels display the behavior of the Stochastic RSI directly on the price chart.
This allows us to visually identify the price levels associated with different stages of the StochRSI momentum cycle.
---
## [ StochRSI 20 ]
StochRSI 20 represents the price level formed when the StochRSI enters the oversold region.
Therefore, for price to begin establishing a meaningful bullish move, one of the first things we need to see is:
> > > Reclaim of StochRSI 20
The fact that StochRSI has reached the bottom is not enough.
Price needs to reclaim the StochRSI 20 level and establish support above it.
---
## [ StochRSI 50 ]
StochRSI 50 can be used as a midpoint reference for short-term momentum.
If price reclaims StochRSI 20 and then breaks above and holds StochRSI 50, it may indicate that short-term bullish momentum is strengthening.
The sequence would be:
StochRSI 20 Reclaim
↓
StochRSI 50 Breakout
↓
Short-Term Momentum Strengthens
---
## [ StochRSI 80 ]
StochRSI 80 represents the price level formed when the StochRSI enters the overbought region.
The StochRSI 80 level currently displayed on the chart represents a previous overbought zone.
Therefore, if price manages to hold around this StochRSI 80 level, it may indicate that:
"The previous overbought zone is being converted into support."
However, price is currently trading below the StochRSI 20 level.
Therefore, the first thing we need to focus on is not StochRSI 80, but:
> > > Whether price can reclaim StochRSI 20
==================================================
[ SBOD CHECK: StochRSI + OBV + BSSC ]
=====================================
StochRSI has now reached its lowest region.
This means the probability of a short-term rebound is gradually increasing.
However, there is an important point to remember.
We should never interpret:
> > > StochRSI Oversold = Automatic Buy Signal
Even if StochRSI begins to rebound, if:
* OBV continues to decline, or
* BSSC remains bearish,
it may indicate that actual buying pressure is still insufficient.
In that case, the market may develop the following structure:
StochRSI Rebound
↓
Short-Term Price Bounce
↓
OBV / BSSC Fail to Recover
↓
Limited Upside
↓
Higher Probability of Another Decline
Therefore, we should not rely on StochRSI alone.
We need to monitor:
> > > StochRSI = Momentum
> > > OBV = Volume / Buying Pressure
> > > BSSC = Trend Strength
together.
==================================================
[ CURRENT ADA TRADING STRATEGY ]
================================
At this stage, the priority is not to find an immediate entry.
The first thing we need to determine is:
> > > Where will DOM(-60) or HA-Low form?
Once one of these Low Zone indicators forms, we can monitor whether price establishes actual support around that level while also checking:
StochRSI
+
OBV
+
BSSC
The preferred sequence is:
DOM(-60) / HA-Low Formation
↓
Support Test
↓
StochRSI Turns Up
↓
OBV Decline Slows or Turns Up
↓
BSSC Recovers
↓
Evaluate Entry
At the moment, these conditions have not yet been sufficiently confirmed.
Therefore:
> > > This is not yet an ideal time for aggressive trading.
Rather than entering too early, it may be better to wait until a new Low Zone forms and support is confirmed.
==================================================
[ CRITICAL LEVEL: 0.1679 ]
==========================
The 0.1679 level requires particular attention.
> > > Holding Above 0.1679
> > > = Rebound potential remains intact within the current key zone.
> > > Breakdown Below 0.1679
> > > = Increased probability of further structural weakness.
If ADA falls below 0.1679 and fails to reclaim the level, I recommend stepping away from short-term trading and reassessing the broader market structure.
The reason is that a move below 0.1679 may signal a transition away from a short-term Trading Zone and into a:
> > > Mid- to Long-Term Accumulation / Investment Zone
In this area, rather than chasing a short-term rebound, it becomes more important to identify where new DOM(-60), HA-Low, and longer-term support levels begin to form.
==================================================
[ ADA KEY TAKEAWAYS ]
=====================
Key Zone
> > > 0.1679 ~ 0.1973
Key Volume Profile
> > > 0.1813
First Requirement for Short-Term Bullish Recovery
> > > Reclaim and Hold StochRSI 20
Potential Low Zone
> > > DOM(-60) / HA-Low
Potential High Zone
> > > DOM(60) / HA-High
Rebound Confirmation
> > > StochRSI + OBV + BSSC
0.1813 Reclaim + Support Confirmation
> > > Higher Probability of Short-Term Upside
0.1679 Breakdown + Failure to Reclaim
> > > Pause Short-Term Trading / Watch for Transition into a Mid- to Long-Term Zone
==================================================
The key question for ADA right now is not:
"How far has price already fallen?"
The real question is:
"Where will support actually be confirmed?"
A large decline alone does not mean that a bottom has formed.
We need to see DOM(-60) or HA-Low form, confirm that price is holding that area as support, and then monitor whether StochRSI, OBV, and BSSC begin to recover together.
That is when we should start considering a trade.
---
Thank you for reading.
Wishing you successful trading.

[Practical trading strategy using HA-MS and SBOD]
youtu.be/aceN1AttX1Y
[Binance Futures Message Channel]
t.me/readcryptobns
[업비트 메시지 채널]
t.me/readcryptoubt
youtu.be/aceN1AttX1Y
[Binance Futures Message Channel]
t.me/readcryptobns
[업비트 메시지 채널]
t.me/readcryptoubt
Related publications
Disclaimer
The information and publications are not meant to be, and do not constitute, financial, investment, trading, or other types of advice or recommendations supplied or endorsed by TradingView. Read more in the Terms of Use.