
🚀
Dropping toward lower pattern demand near 0.2131! Are you panic-selling this pull-down into ascending support, or locked in for the multi-wave liquidity sweep and breakout surge to overhead resistance? 🤔
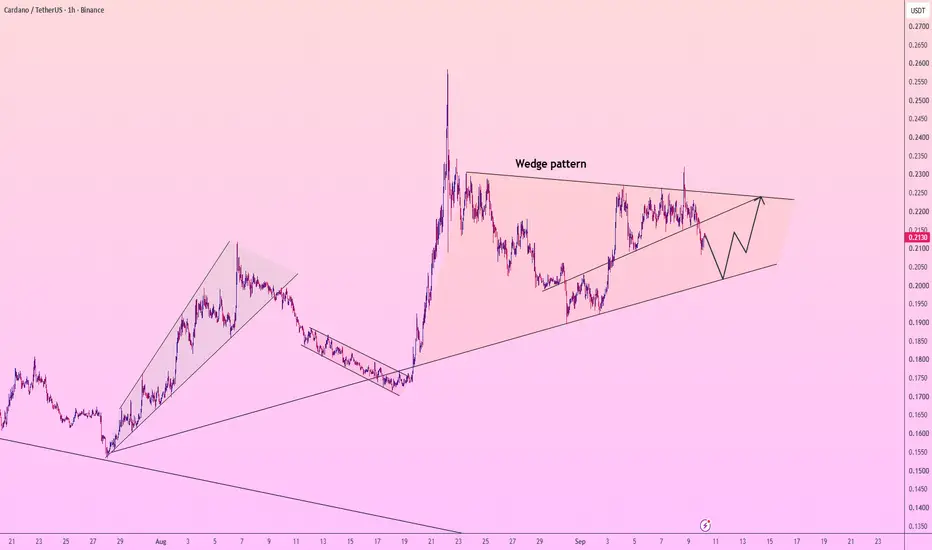
Cardano is coiling inside a broad converging Wedge pattern structure on this 1-hour Binance chart. ADA/USDT is trading around 0.2131, retracing toward its primary ascending lower support line around $0.2030 - $0.2040 to sweep sell-side liquidity before institutional buyers step in to initiate a multi-wave expansion campaign. 📈💥
Look closely at the black blueprint trajectory mapping out the upcoming sessions. The algorithm projects a textbook multi-wave accumulation, retest, and expansion sequence:
• An initial localized flush driving price down to retest lower ascending Wedge pattern support near $0.2030 - $0.2040 to sweep weak-hand stops and trigger institutional buy blocks. 🧹
• An immediate high-velocity impulse rebound surging back up toward the $0.2150 region. ⚡
• A healthy higher-low pullback dipping back toward $0.2100 to confirm structural support and absorb remaining sell liquidity. 🌊
• A secondary expansion wave driving price through local structure toward $0.2180. 🧱
• A minor higher-low consolidation retest dipping to $0.2130 to lock in secondary support. ⚡
• Final acceleration surge driving straight up to target the primary upper Wedge pattern resistance ceiling near $0.2240 - $0.2250. 🎯🏹
Maintaining technical patience and aligning with trendline demand is your ultimate superpower in this setup. Trying to short directly into a primary ascending support floor after an extended drop is a fast track to getting caught on the wrong side of an aggressive expansion squeeze. Smart money is waiting for this flush into $0.2030 support to exhaust before accumulating long position blocks alongside the recovery flow. 🧘♂️⚡
🛠 Trade Parameters:
🛒 Long Zone: 0.2020 - 0.2050 🛍️
🛑 Stop-Loss: 1h close below 0.1970 ❌
💰 Take-Profit: 0.2240 🎯
The retail bears attempting to short late into ascending support are about to get caught offside as institutional buy volume defends the floor. Stay focused, strictly manage your risk, and let the algorithm carry the trade up to our target.
Maintain your composure through the waves, and we will see you up at the $0.2240 resistance ceiling! 🚀💎

🥇 Gold & Forex market analysis
📊 Key levels, chart patterns & market scenarios
🛠 TradingView indicator + online technical analysis
👇 Explore the tools and follow my updates:
t.me/lingridchannel
📊 Key levels, chart patterns & market scenarios
🛠 TradingView indicator + online technical analysis
👇 Explore the tools and follow my updates:
t.me/lingridchannel
Disclaimer
The information and publications are not meant to be, and do not constitute, financial, investment, trading, or other types of advice or recommendations supplied or endorsed by TradingView. Read more in the Terms of Use.