
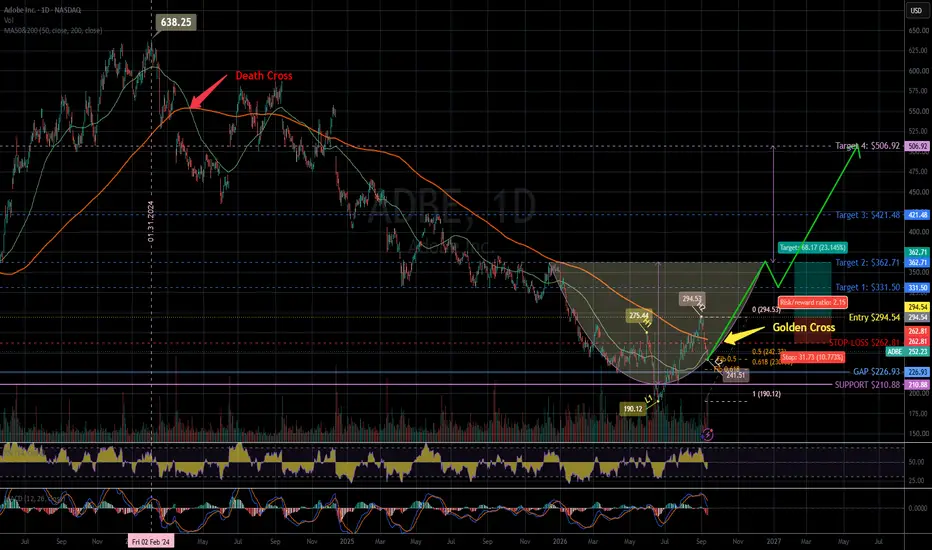
Adobe has been in a prolonged downtrend for approximately 2.5 years, with price consistently trading below the MA50.
However, the structure may now be changing. A potentially important reversal pattern is developing, with several possible bullish scenarios ahead.
* Two chart patterns may be forming: a Golden Cross and a Bowl pattern.
* The MA50 is now approaching the MA200, making this a particularly interesting point in the long-term structure.
. Before the current correction, ADBE experienced a strong upside move that broke above the MA200 for approximately 11 trading sessions but ultimately failed to hold the breakout and pulled back.
. That breakout was still significant because it created a new high, H2, above the previous high, H1.
. The key question now is whether the recent low, L2, can remain above the previous low, L1 — potentially creating a higher low — or whether ADBE will continue lower?
. Friday's green candle closed at $252.23, with volume of approximately 10.8M. Could this be the low that establishes L2?
. In my view, L2 is currently in a relatively strong position because it remains significantly above L1.
* Fibonacci analysis of the L1 → H2 move also supports this idea. L2 is currently located within the retracement zone of that move, just below the 0.5 Fibonacci level.
. Based on this structure, I believe L2 could be confirmed relatively soon if price continues to hold this area.
* Volume also provides another interesting signal. Based on my own chart review, average daily volume during 2026 appears to be approximately 4M shares, roughly twice the average daily volume seen during 2024–2025.
These volume figures are approximate and based on my own chart observation.
https://www.tradingview.com/x/qfK8tHqv/
*The potential Bowl pattern provides several upside scenarios. If the recovery continues, Target 2 at $362.71 would represent the minimum major objective of this pattern.
If the Bowl eventually develops into a Cup and Handle, the longer-term Target 4 at $506.92 could become the ultimate target for this setup.
. Target 1 ($331.50) and Target 2 ($362.71) are based primarily on key support/resistance levels and the Bowl structure.
. Target 3 ($421.48) and Target 4 ($506.92) are based on key support/resistance levels combined with Fibonacci Extension projections.
* Entry: $294.54
For a more conservative entry, I would prefer to see price return to H2 ($294.53) and successfully retest that level.
This would provide additional confirmation that the current structure is developing into a bullish reversal rather than simply another temporary rebound.
* Stop-loss: $262.81 (-10.77%)
* Targets:
Target 1: $331.50
Target 2: $362.71
Target 3: $421.48
Target 4: $506.92
Risk/Reward: 2.15
ADBE could become very interesting in the coming months, with multiple potential entry opportunities depending on how the price structure develops.
*** The reason I am publishing this setup now is not simply because ADBE has fallen significantly.
The most important reason is that a Golden Cross may be approaching in the near future.
If the MA50 crosses above the MA200 while price continues to build a higher-low structure, this could mark an important transition from a long-term downtrend toward a new bullish phase.
IMO, amateur trader.
Good luck!

Disclaimer
The information and publications are not meant to be, and do not constitute, financial, investment, trading, or other types of advice or recommendations supplied or endorsed by TradingView. Read more in the Terms of Use.
Disclaimer
The information and publications are not meant to be, and do not constitute, financial, investment, trading, or other types of advice or recommendations supplied or endorsed by TradingView. Read more in the Terms of Use.