
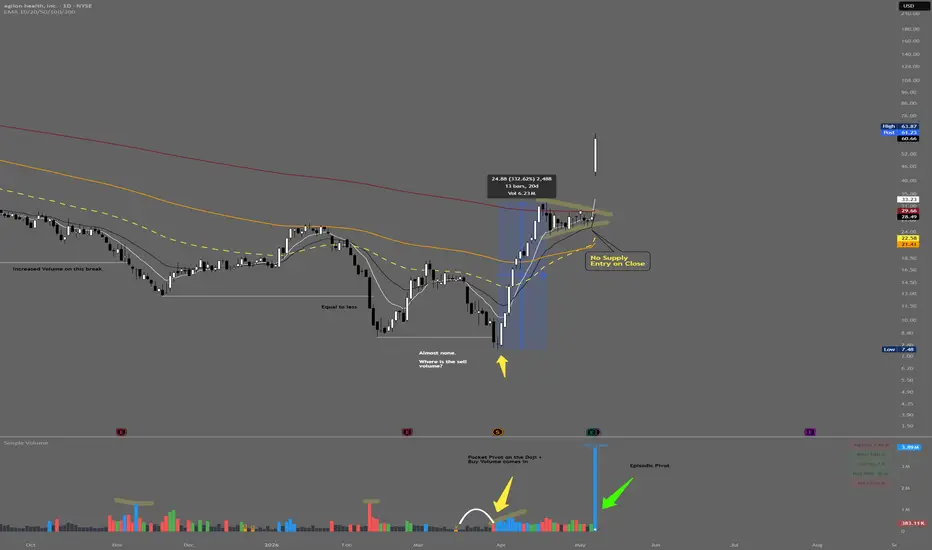
Never before have I seen such perfect examples of all 3 of these models take place basically within a month of each other. Add this one to your Database. Full transparency, I was not involved in any stage but I saw it pop up today and I had to share it
HTF Context:
The first thing to notice is what happened into the lows. As price broke the last 3 swing lows, volume was progressively drying up. That suggested supply was becoming less effective and participants were no longer pressing price lower with the same force.
Phase 1 — Reversal Extension:
After supply dried up, the character changed. A pocket pivot doji formed, followed by an engulfing drop-base-rally and increasing buy volume. That was the first real clue that the auction was shifting from downside pressure into upside expansion.
Phase 2 — High Tight Flag / Crossback:
From there, price expanded roughly 332%, then began holding higher instead of giving the move back. This is where the setup became educational. Price started surfing the EMAs and compressing near the highs. The no-supply hammer off the 10/20 was another sign that rejection was limited and participants were still accepting higher prices.
Phase 3 — Episodic Pivot:
A couple of days later, on 5/6 earnings dropped after hours, gapping higher for 5/7 where the next expansion phase arrived through an episodic pivot. That was not random. It came after a clear sequence of dried-up supply, reversal, strong expansion, and constructive continuation structure.
Execution Mindset:
The lesson here is not “look for this exact candle.” The lesson is to see how each of these events unfold and build a database of each of them so you can identify similar setups in the future.
- Supply drying up
- Change in participation
- Reversal extensions away from 10/20
- Acceptance at higher prices
- Compression while surfing the EMAs
- Fresh expansion through an episodic pivot
Each and every one of these can be responsible for big moves. All of them together in rapid succession is like a solar eclipse. Extremely rare but you see the result
This is one of those charts that belongs in the database. Not because it was easy to trade, but because it shows the full sequence: supply exhaustion, reversal expansion, higher acceptance, compression, and then episodic continuation.

Disclaimer
The information and publications are not meant to be, and do not constitute, financial, investment, trading, or other types of advice or recommendations supplied or endorsed by TradingView. Read more in the Terms of Use.
Disclaimer
The information and publications are not meant to be, and do not constitute, financial, investment, trading, or other types of advice or recommendations supplied or endorsed by TradingView. Read more in the Terms of Use.