
📊 Technical Analysis — AALGO/USDT
Time Frame: 1W (Weekly)
Exchange: Binance
Current Price: ± $0.0905
Key Support Zone: $0.0905 – $0.0750
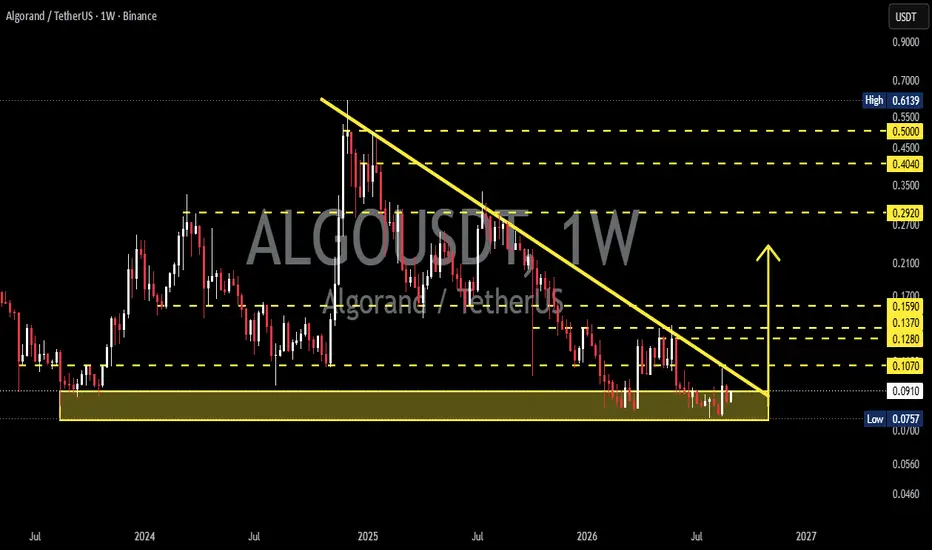
 ALGO is currently sitting at a highly critical technical area. Price has been under long-term bearish pressure and continues to trade below the descending trendline that has been forming since the major high around $0.60.
However, one important factor is that price has returned directly to the $0.0905–$0.0750 historical support zone, which could potentially act as an accumulation area and a key decision zone for the next major move.
---
📐 PATTERN — DESCENDING TRIANGLE / BEARISH CONSOLIDATION
The chart shows characteristics of a Descending Triangle, including:
🔻 Lower Highs Continue to Form — each rebound tends to fail to create a higher high.
📉 Descending Trendline — the yellow trendline acts as dynamic resistance and has repeatedly pressured price lower.
🟨 Horizontal Support Zone — the $0.0905–$0.0750 area represents the main support base where price has repeatedly received buying interest.
⚠️ The combination of lower highs + horizontal support gives the structure a bearish bias until a confirmed breakout occurs.
However, because price is now approaching the end of the structure, a breakout in either direction could potentially trigger a significant move.
---
🟢 BULLISH SCENARIO — DESCENDING TRENDLINE BREAKOUT
The bullish scenario becomes increasingly attractive ifALGO manages to break above and hold above the descending trendline.
📈 Main Confirmation: Weekly candle closes above the descending trendline.
🔥 A breakout accompanied by stronger momentum would indicate that long-term bearish pressure may be weakening.
🎯 Potential Bullish Targets
1️⃣ $0.1070 — First resistance
2️⃣ $0.1280 — Next resistance
3️⃣ $0.1370 — Resistance area
4️⃣ $0.1590 — Important resistance
5️⃣ $0.2920 — Major resistance / medium-term target
6️⃣ $0.4040 — Major resistance
7️⃣ $0.5000 — Psychological & historical resistance
🚀 IfALGO successfully breaks out and then retests the descending trendline as support, the bullish structure would become significantly more valid.
📌 A Breakout → Retest → Continuation structure would provide stronger confirmation than a breakout without a retest.
---
🔴 BEARISH SCENARIO — $0.0750 SUPPORT FAILURE
On the other hand, ifALGO fails to maintain the $0.0905–$0.0750 support zone, the bearish structure could regain momentum.
⚠️ The most important level is $0.0750.
If a clear weekly candle closes below $0.0750, the main support zone on the chart can be considered broken.
📉 This could potentially open the way for:
🔻 Continuation of the long-term downtrend
🔻 Formation of new lower lows
🔻 Increased selling pressure
🔻 Price discovery toward lower support areas
In this scenario, the bullish thesis would become invalid or at least significantly delayed until a new reversal structure develops.
---
🟨 SUPPORT ZONE — $0.0905–$0.0750
The yellow zone is the most important area on the chart right now.
🟨 $0.0905 → Upper boundary of the support zone
🟨 $0.0750 → Lower boundary / major support
As long as price remains capable of holding this zone, the possibility of base formation / accumulation remains open.
💡 The more frequently support is tested, the more important the price reaction becomes. However, repeated retests can also increase the risk of an eventual breakdown.
Therefore, the price reaction around $0.0750–$0.0905 will be crucial in determiningALGO's next major structure.
---
🎯 KEY LEVELS TO WATCH
Level Significance
🟨 $0.0750 Major Support / Breakdown Level
🟨 $0.0905 Current Support / Zone Boundary
🔑 $0.1070 First Resistance
🔑 $0.1280 Resistance
🔑 $0.1370 Resistance
🔑 $0.1590 Major Resistance
🚀 $0.2920 Major Medium-Term Target
🚀 $0.4040 Major Resistance
🚀 $0.5000 Major Psychological Resistance
---
⚖️ OVERALL MARKET BIAS
📉 Current Bias: Bearish until breakout
The long-term structure ofALGO remains bearish because price is still trading below the descending trendline.
However, price is currently positioned inside the $0.0905–$0.0750 support zone, creating the possibility of a reversal if buyers manage to take control of momentum.
🟢 Bullish
Break & weekly close above the descending trendline → confirmation of a potential trend reversal.
🔴 Bearish
Weekly breakdown below $0.0750 → continuation of the bearish structure.
👀 MOST IMPORTANT LEVELS:
$0.0750 Support vs. Descending Trendline Resistance
Until either of these levels is decisively broken and confirmed,ALGO remains in a major decision zone.
---
🧠 FINAL OUTLOOK
ALGO is facing a critical technical decision after a prolonged downtrend.
🟨 The $0.0905–$0.0750 zone represents a very important defense area within the current structure.
📈 If buyers manage to defend this zone and price breaks the descending trendline, a recovery toward $0.107 → $0.128 → $0.137 → $0.159 could become possible, with higher targets at $0.292 → $0.404 → $0.500 if bullish momentum continues.
📉 Conversely, losing $0.0750 on the weekly timeframe would provide a much stronger bearish signal and could potentially lead to further lower lows.
For now, the key is not predicting the breakout — but waiting for the market to confirm which side wins. ⚔️
#ALGO #Algorand #ALGOUSDT #Crypto #Cryptocurrency #TechnicalAnalysis #CryptoTrading #Altcoins #AltcoinAnalysis #PriceAction #Bullish #Bearish #Breakout #Support #Resistance
Time Frame: 1W (Weekly)
Exchange: Binance
Current Price: ± $0.0905
Key Support Zone: $0.0905 – $0.0750
ALGO is currently sitting at a highly critical technical area. Price has been under long-term bearish pressure and continues to trade below the descending trendline that has been forming since the major high around $0.60.However, one important factor is that price has returned directly to the $0.0905–$0.0750 historical support zone, which could potentially act as an accumulation area and a key decision zone for the next major move.
---
📐 PATTERN — DESCENDING TRIANGLE / BEARISH CONSOLIDATION
The chart shows characteristics of a Descending Triangle, including:
🔻 Lower Highs Continue to Form — each rebound tends to fail to create a higher high.
📉 Descending Trendline — the yellow trendline acts as dynamic resistance and has repeatedly pressured price lower.
🟨 Horizontal Support Zone — the $0.0905–$0.0750 area represents the main support base where price has repeatedly received buying interest.
⚠️ The combination of lower highs + horizontal support gives the structure a bearish bias until a confirmed breakout occurs.
However, because price is now approaching the end of the structure, a breakout in either direction could potentially trigger a significant move.
---
🟢 BULLISH SCENARIO — DESCENDING TRENDLINE BREAKOUT
The bullish scenario becomes increasingly attractive if
ALGO manages to break above and hold above the descending trendline.📈 Main Confirmation: Weekly candle closes above the descending trendline.
🔥 A breakout accompanied by stronger momentum would indicate that long-term bearish pressure may be weakening.
🎯 Potential Bullish Targets
1️⃣ $0.1070 — First resistance
2️⃣ $0.1280 — Next resistance
3️⃣ $0.1370 — Resistance area
4️⃣ $0.1590 — Important resistance
5️⃣ $0.2920 — Major resistance / medium-term target
6️⃣ $0.4040 — Major resistance
7️⃣ $0.5000 — Psychological & historical resistance
🚀 If
ALGO successfully breaks out and then retests the descending trendline as support, the bullish structure would become significantly more valid.📌 A Breakout → Retest → Continuation structure would provide stronger confirmation than a breakout without a retest.
---
🔴 BEARISH SCENARIO — $0.0750 SUPPORT FAILURE
On the other hand, if
ALGO fails to maintain the $0.0905–$0.0750 support zone, the bearish structure could regain momentum.⚠️ The most important level is $0.0750.
If a clear weekly candle closes below $0.0750, the main support zone on the chart can be considered broken.
📉 This could potentially open the way for:
🔻 Continuation of the long-term downtrend
🔻 Formation of new lower lows
🔻 Increased selling pressure
🔻 Price discovery toward lower support areas
In this scenario, the bullish thesis would become invalid or at least significantly delayed until a new reversal structure develops.
---
🟨 SUPPORT ZONE — $0.0905–$0.0750
The yellow zone is the most important area on the chart right now.
🟨 $0.0905 → Upper boundary of the support zone
🟨 $0.0750 → Lower boundary / major support
As long as price remains capable of holding this zone, the possibility of base formation / accumulation remains open.
💡 The more frequently support is tested, the more important the price reaction becomes. However, repeated retests can also increase the risk of an eventual breakdown.
Therefore, the price reaction around $0.0750–$0.0905 will be crucial in determining
ALGO's next major structure.---
🎯 KEY LEVELS TO WATCH
Level Significance
🟨 $0.0750 Major Support / Breakdown Level
🟨 $0.0905 Current Support / Zone Boundary
🔑 $0.1070 First Resistance
🔑 $0.1280 Resistance
🔑 $0.1370 Resistance
🔑 $0.1590 Major Resistance
🚀 $0.2920 Major Medium-Term Target
🚀 $0.4040 Major Resistance
🚀 $0.5000 Major Psychological Resistance
---
⚖️ OVERALL MARKET BIAS
📉 Current Bias: Bearish until breakout
The long-term structure of
ALGO remains bearish because price is still trading below the descending trendline.However, price is currently positioned inside the $0.0905–$0.0750 support zone, creating the possibility of a reversal if buyers manage to take control of momentum.
🟢 Bullish
Break & weekly close above the descending trendline → confirmation of a potential trend reversal.
🔴 Bearish
Weekly breakdown below $0.0750 → continuation of the bearish structure.
👀 MOST IMPORTANT LEVELS:
$0.0750 Support vs. Descending Trendline Resistance
Until either of these levels is decisively broken and confirmed,
ALGO remains in a major decision zone.---
🧠 FINAL OUTLOOK
ALGO is facing a critical technical decision after a prolonged downtrend.🟨 The $0.0905–$0.0750 zone represents a very important defense area within the current structure.
📈 If buyers manage to defend this zone and price breaks the descending trendline, a recovery toward $0.107 → $0.128 → $0.137 → $0.159 could become possible, with higher targets at $0.292 → $0.404 → $0.500 if bullish momentum continues.
📉 Conversely, losing $0.0750 on the weekly timeframe would provide a much stronger bearish signal and could potentially lead to further lower lows.
For now, the key is not predicting the breakout — but waiting for the market to confirm which side wins. ⚔️
#ALGO #Algorand #ALGOUSDT #Crypto #Cryptocurrency #TechnicalAnalysis #CryptoTrading #Altcoins #AltcoinAnalysis #PriceAction #Bullish #Bearish #Breakout #Support #Resistance

✅ Get Free Signals! Join Our Telegram Channel Here: t.me/TheCryptoNuclear
✅ Twitter: twitter.com/crypto_nuclear
✅ Join Bybit : partner.bybit.com/b/nuclearvip
✅ Benefits : Lifetime Trading Fee Discount -50%
✅ Twitter: twitter.com/crypto_nuclear
✅ Join Bybit : partner.bybit.com/b/nuclearvip
✅ Benefits : Lifetime Trading Fee Discount -50%
Disclaimer
The information and publications are not meant to be, and do not constitute, financial, investment, trading, or other types of advice or recommendations supplied or endorsed by TradingView. Read more in the Terms of Use.