
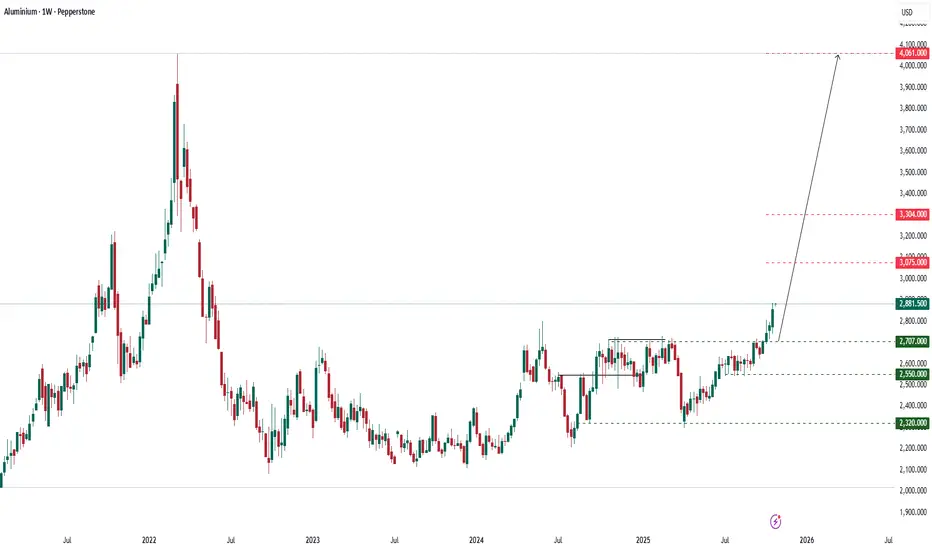
Technical Analysis – Aluminium Futures
Date: October 27, 2025 | Timeframe: Weekly | Exchange: Pepperstone CFD (LME Reference)
1. Trend Overview and Price Structure
Aluminium futures closed the week at USD 2,882/ton, up +0.9% from the previous week, confirming a breakout above the medium-term resistance zone of USD 2,700/ton.
The technical structure shows an 18-month accumulation base (from March 2023 to September 2025), now evolving into a new medium-to-long-term bullish cycle, targeting USD 3,075 → 3,304 → 4,061/ton.
Overall trend: Medium-term bullish, with solid support at USD 2,700.
2. Key Technical Price Levels
Resistance: 3,075 – 3,304 – 4,061
Support: 2,707 – 2,550 – 2,320
3. Detailed Technical Analysis
(1) Short-Term Trend
A decisive breakout above 2,707 confirms that a new medium-term impulse wave has begun.
If prices hold above this level for two consecutive weeks, aluminium may enter an accelerated rally toward 3,075.
(2) Volume and Open Interest
Open interest (OI) on LME and SHFE rose 7–9% over the past two weeks, signaling fresh speculative inflows and increased hedging activity by Asian producers.
(3) Elliott Wave Structure
Wave 1 (cycle bottom): 2,320 → 2,707
Wave 2: Minor correction
Wave 3 (in progress): Expansion phase targeting 3.30–3.40 (Fibonacci 161.8%)
Waves 4 & 5: Expected completion near 4.00–4.10
(4) Trend Confirmation Signals
Weekly close above 2,880 confirms a full breakout.
EMA-50 crossed above EMA-200 on the weekly chart — a clear long-term trend reversal signal.
4. VNC Intelligence View – Strategic Outlook
Macro and Structural Drivers
Aluminium’s rally is underpinned by strong fundamental catalysts:
Output Cuts in China: Power shortages in Guizhou and Yunnan have forced 6–8% production cuts among smelters.
(CNIA, Oct 24)
Rising Demand from the Green Energy Sector: Global aluminium demand from solar, EV, and power grid infrastructure rose 12% YoY, led by India and China.
(Bloomberg, Oct 21): Sharp Inventory Decline on LME. LME-registered aluminium stocks fell to 385,000 tons, the lowest since Feb 2022.
(LME, Oct 25)
Europe’s Secondary Production Cuts: High energy costs continue to limit capacity in Germany and France, tightening global supply.
(Reuters, Oct 23)
Higher Industrial Power Costs in China: Average industrial electricity prices up 5% since September, lifting production costs and supporting price recovery. (Shanghai Metals Market, Oct 18)
VNC Intelligence Assessment (BI View):
Short-Term (2–3 weeks): Range-bound consolidation 2,850–2,950 before the next leg higher.
Medium-Term (4–6 weeks): Upside targets 3,075–3,304 on robust macro and supply-side tailwinds.
Long-Term (Q1 2026): High probability of USD 4,000/ton if China maintains current power-use restrictions.
5. Suggested Technical Strategies
Preferred Long Setup (Primary Scenario):
Entry: 2,850 – 2,880 (retest of breakout zone)
Targets: TP1 3,075 | TP2 3,304 | TP3 4,061
Stop-Loss: 2,700
Probability: 75%
Rationale: Long-term base breakout confirmed by volume and macro fundamentals.
Counter-Trend Short Setup (Profit-Taking):
Entry: 3,300 – 3,320
Target: 2,900
Stop-Loss: 3,380
Probability: 25%
Rationale: Tactical pullback trade at Fibonacci 161.8% resistance.
6. Corporate Hedging Strategies
Asian Aluminium Producers: Consider short-hedging 30–40% of Q2-2026 output near 3,300–3,400, securing margins amid rising energy costs.
Aluminium Consumers (EV, Construction, Packaging): Initiate long hedges below 3,000, as Q1-2026 projections point toward 3,800–4,000/ton.
Medium-Term Investors: Maintain long exposure from 2,800–2,850 with a 3-month return potential of 15–20%.
VNC Intelligence Summary:
Aluminium has entered a confirmed structural uptrend, driven by tightening Chinese supply and accelerating green-energy demand.
With inventories at multi-year lows and macro conditions supportive, prices are likely to retest USD 3,300–3,400 in the near term and could approach USD 4,000 by early 2026 if energy constraints persist.

Related publications
Disclaimer
The information and publications are not meant to be, and do not constitute, financial, investment, trading, or other types of advice or recommendations supplied or endorsed by TradingView. Read more in the Terms of Use.
Related publications
Disclaimer
The information and publications are not meant to be, and do not constitute, financial, investment, trading, or other types of advice or recommendations supplied or endorsed by TradingView. Read more in the Terms of Use.