
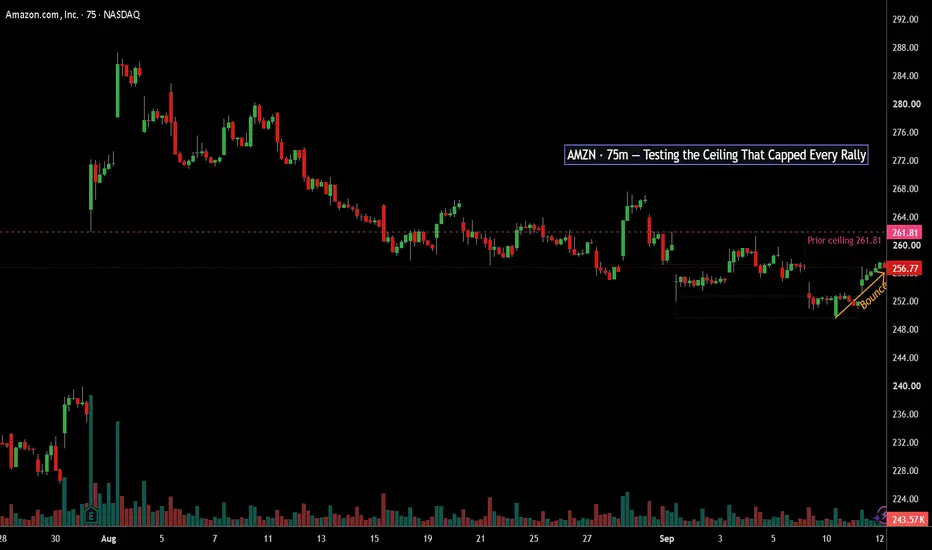
Is the level that's turned back every rally in this move finally about to give?
AMZN spent the last several sessions building a base in the 249.58–252.76 zone after sliding out of the mid-260s, tested and held on repeated touches rather than breaking down further. That's the first half of the story. The second half is the zone directly overhead: 257.2 to 261.81, a ceiling that capped every bounce attempt through the entire decline — six separate touches, all rejected in the same band.
Price is back at that ceiling right now, at 256.77, riding the trendline off the 249.58 low. The move up has been steady rather than explosive — no single outsized volume bar driving it, which cuts both ways: no obvious exhaustion yet, but also no confirmation that buyers have real conviction behind this specific push.
A close through 261.81 on above-average volume would be the first genuine break of a level that's held for the entire structure. A rejection back into the 249–252 zone would mean the range holds a while longer.
So which is it — does six-for-six resistance make it seven, or does this base finally have enough underneath it to punch through? What would you need to see on the next few bars to believe the breakout?
Educational chart analysis, not a trade recommendation — position sizing and risk are on you.

🌳Indicator:bit.ly/2DJVXDn 💚
🦄telegram:t.me/longbuylongsellindicator 🟢
✔️contact:t.me/wealthworldmajic
🎯web:marxcbabu.blogspot.com/
🟠twitter:twitter.com/marxcbabu 💲
youtube.com/@marxcbabu/videos
🦄telegram:t.me/longbuylongsellindicator 🟢
✔️contact:t.me/wealthworldmajic
🎯web:marxcbabu.blogspot.com/
🟠twitter:twitter.com/marxcbabu 💲
youtube.com/@marxcbabu/videos
Disclaimer
The information and publications are not meant to be, and do not constitute, financial, investment, trading, or other types of advice or recommendations supplied or endorsed by TradingView. Read more in the Terms of Use.