
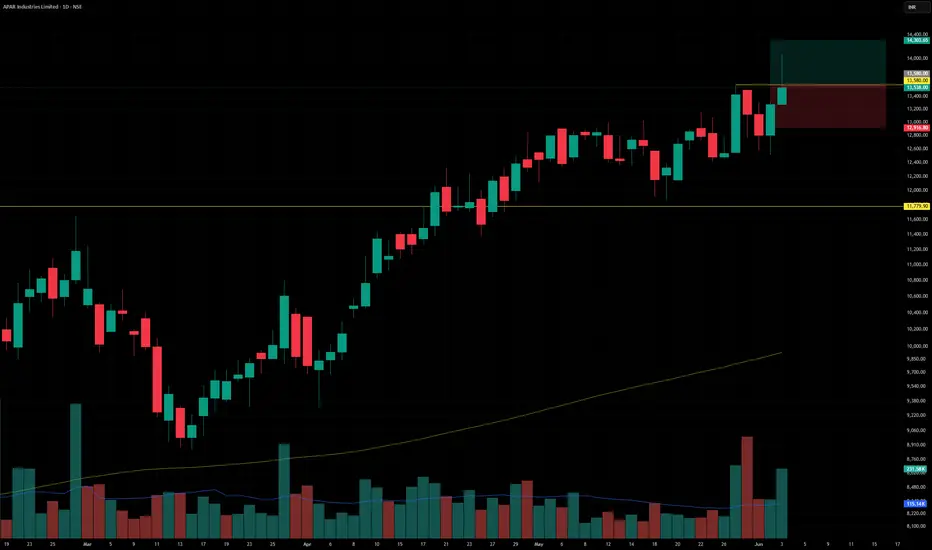
APAR Industries Ltd. (CMP ₹13,538.00, NSE: APARINDS)
Prepared by Sucrit Patil | The SmartWay Research Desk | 4 June 2026
A Mumbai‑based global energy infrastructure solutions provider, incorporated in 1958. APAR Industries operates across conductors, cables, specialty oils, and polymers, serving utilities, renewables, automotive, and industrial sectors worldwide.
Promoter Holding (Mar 2026): Desai Family — 57.77% stake (no pledges)
FY22–FY26 Snapshot
Revenue Growth: FY26 revenue ₹22,902 Cr vs ₹18,542 Cr in FY25 (+23.6% YoY). → Good
Net Profit: FY26 PAT ₹977 Cr vs ₹822 Cr in FY25 (+18.9% YoY). → Good
Operating Margin: FY26 EBITDA ₹2,312 Cr, margin 10.1% vs 9.5% last year (+60 bps). → Good
Equity Capital: Stable, face value ₹10. → Good
Dividend Policy: Dividend ₹51.00/share declared for FY26. → Good
Asset Building: Investments in premium cables, EV charging solutions, and export markets. → Good
Sales: Strong demand from renewables, automotive, and industrial sectors. → Good
Expense: Raw material cost pressures (aluminium, copper) remain. → Neutral/Good
EPS: FY26 EPS ₹242.81 vs ₹204.30 last year (+18.8%). → Good
Institutional Interest & Ownership Trends (Mar 2026)
Promoter Holding: 57.77% (no pledges)
FII Holding: 9.38% (up from 9.35%)
Mutual Fund Holding: 22.25% (up from 21.55%)
Retail & Others: 8.71%
Strategic Moves & Innovations
Expansion in EV charging cables and specialty oils.
Focus on renewable energy transmission and smart grids.
Partnerships with global OEMs for automotive cables.
Diversification into premium export markets (U.S., Europe).
Cash Flow & Balance Sheet Strength
Market cap ~₹55,800 Cr.
Debt‑to‑equity ratio ~0.18 (low leverage).
Book value per share ₹412.00; P/B ~32.9.
EPS (TTM) ₹242.81; P/E ~55.7.
Risk Factors
High P/E ratio ~55.7, indicating premium valuations.
Dependence on commodity cycles (aluminium, copper).
Exposure to global trade and tariff risks.
Competition from Polycab India, Finolex Cables, and KEI Industries.
Investor Takeaway
APAR Industries has delivered robust FY26 performance, with revenue up 23.6% and PAT up 18.9%. With strong promoter backing, institutional interest, and leadership in conductors, cables, and specialty oils, APAR remains a premium play on India’s energy infrastructure and EV ecosystem. At CMP ₹13,538.00, valuations are expensive (P/E ~55.7, P/B ~32.9), but justified by growth momentum and sector tailwinds.

Sucrit.D.Patil
Disclaimer
The information and publications are not meant to be, and do not constitute, financial, investment, trading, or other types of advice or recommendations supplied or endorsed by TradingView. Read more in the Terms of Use.
Sucrit.D.Patil
Disclaimer
The information and publications are not meant to be, and do not constitute, financial, investment, trading, or other types of advice or recommendations supplied or endorsed by TradingView. Read more in the Terms of Use.