We’ve seen a risk-on start to the week’s trading, with global markets rallying on hopes that Donald Trump and Xi Jinping will agree to extend their trade truce during a high-stakes meeting in South Korea. Asian equities surged, commodity prices strengthened, and risk-sensitive currencies like the Australian dollar gapped higher at the Sunday open.
Optimism Sweeps Across Asia
Asia led the charge, with Japan’s Nikkei 225 climbing to break above 50,000 for the first time, while South Korea’s Kospi hit fresh record highs. Optimism around US–China trade relations and Japan’s new Prime Minister Sanae Takaichi’s pro-growth agenda fuelled strong inflows into equities. Meanwhile, gold fell more than 1% and Bitcoin extended its weekend rally, reflecting a broad shift away from defensive assets.
For the Aussie dollar, this improving sentiment and stronger tone in global commodities provided the perfect spark. As one of the most cyclical major currencies, the Aussie tends to thrive when markets embrace risk and the growth outlook stabilises. The question now is whether the pair can build on its initial burst of momentum as liquidity deepens through the London and US sessions.
Compression Turns to Expansion
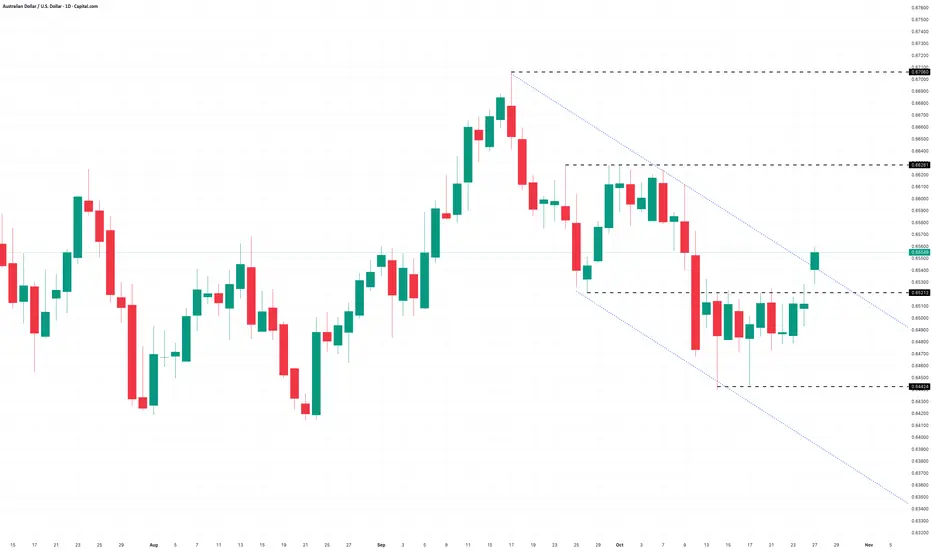
AUD/USD’s technical landscape has been a story of compression and expansion. Since mid-September, prices have been expanding lower and compressing sideways, forming a clearly defined series of lower swing highs. Today’s price action is trying to buck that trend… having expanded lower at the start of October, the market spent the last three weeks coiling within a tight range (blue box) just beneath horizontal swing resistance.
Today’s gap higher saw the pair break through that resistance, signalling a potential shift from compression to expansion higher. However, price is now testing the descending trendline drawn from the recent series of lower highs. Traders will be watching for a daily close above this level to confirm a short-term change in momentum and trend dynamics.
AUD/USD Daily Candle Chart

Past performance is not a reliable indicator of future results
Zooming into the hourly chart, we can see how the breakout unfolded with a clean move above range resistance, followed by a brief pullback and stabilisation just beneath the trendline. Sustained trade above this area could invite follow-through buying, while a sharp rejection would risk pulling price back into the prior range.
AUD/USD Hourly Candle Chart

Past performance is not a reliable indicator of future results
Disclaimer: This is for information and learning purposes only. The information provided does not constitute investment advice nor take into account the individual financial circumstances or objectives of any investor. Any information that may be provided relating to past performance is not a reliable indicator of future results or performance. Social media channels are not relevant for UK residents.
Spread bets and CFDs are complex instruments and come with a high risk of losing money rapidly due to leverage. 85.24% of retail investor accounts lose money when trading spread bets and CFDs with this provider. You should consider whether you understand how spread bets and CFDs work and whether you can afford to take the high risk of losing your money.
Optimism Sweeps Across Asia
Asia led the charge, with Japan’s Nikkei 225 climbing to break above 50,000 for the first time, while South Korea’s Kospi hit fresh record highs. Optimism around US–China trade relations and Japan’s new Prime Minister Sanae Takaichi’s pro-growth agenda fuelled strong inflows into equities. Meanwhile, gold fell more than 1% and Bitcoin extended its weekend rally, reflecting a broad shift away from defensive assets.
For the Aussie dollar, this improving sentiment and stronger tone in global commodities provided the perfect spark. As one of the most cyclical major currencies, the Aussie tends to thrive when markets embrace risk and the growth outlook stabilises. The question now is whether the pair can build on its initial burst of momentum as liquidity deepens through the London and US sessions.
Compression Turns to Expansion
AUD/USD’s technical landscape has been a story of compression and expansion. Since mid-September, prices have been expanding lower and compressing sideways, forming a clearly defined series of lower swing highs. Today’s price action is trying to buck that trend… having expanded lower at the start of October, the market spent the last three weeks coiling within a tight range (blue box) just beneath horizontal swing resistance.
Today’s gap higher saw the pair break through that resistance, signalling a potential shift from compression to expansion higher. However, price is now testing the descending trendline drawn from the recent series of lower highs. Traders will be watching for a daily close above this level to confirm a short-term change in momentum and trend dynamics.
AUD/USD Daily Candle Chart
Past performance is not a reliable indicator of future results
Zooming into the hourly chart, we can see how the breakout unfolded with a clean move above range resistance, followed by a brief pullback and stabilisation just beneath the trendline. Sustained trade above this area could invite follow-through buying, while a sharp rejection would risk pulling price back into the prior range.
AUD/USD Hourly Candle Chart
Past performance is not a reliable indicator of future results
Disclaimer: This is for information and learning purposes only. The information provided does not constitute investment advice nor take into account the individual financial circumstances or objectives of any investor. Any information that may be provided relating to past performance is not a reliable indicator of future results or performance. Social media channels are not relevant for UK residents.
Spread bets and CFDs are complex instruments and come with a high risk of losing money rapidly due to leverage. 85.24% of retail investor accounts lose money when trading spread bets and CFDs with this provider. You should consider whether you understand how spread bets and CFDs work and whether you can afford to take the high risk of losing your money.
Disclaimer
The information and publications are not meant to be, and do not constitute, financial, investment, trading, or other types of advice or recommendations supplied or endorsed by TradingView. Read more in the Terms of Use.
Disclaimer
The information and publications are not meant to be, and do not constitute, financial, investment, trading, or other types of advice or recommendations supplied or endorsed by TradingView. Read more in the Terms of Use.